
Chapter 14 - Education
What Is The Relationship Between Education and Money?
Here’s the fact, pure and simple—more education means more money and opportunity in the United States. Typically, the higher your education the higher your economic status, power, prestige, and levels of property. Socio-Economic Status (SES) is a combination of one's education, occupation, and income and has been found to be highly correlated with a better quality of life for those in society who have higher SES scores. There is more job stability (less unemployment and more pay) for those with higher educations. In Figure 1 below you can see data extracted from the US Census Bureau on this.
Figure 1 shows the median weekly pay based on level of degree attained for the year 2019. These are not theoretical numbers they are actual pay levels for the year 2019 using sophisticated sampling procedures to ensure the data’s accuracy. You can see that the higher the degree you have earned the higher the median weekly salary. Those with Doctoral level degrees made about $1,880 per week which translates to approximately $97,760 per year. Those with a Masters degree made $1,497 per week or $77,844 per year. Those with a Bachelor’s degree made $1,248 per week or $64,896 per year. Then the median pay levels begin to decline. Those with an Associates degree made $887 per week or $46,124 per year while those who attended college but never graduates made $833 per week or $43,316 per year. Those with only a high school degree made $746 per week or $38,792 per year. Those with less than a high school diploma or GED made only $592 per week or $30,784 per year.
Why graduate with a bachelor’s degree? Well the pay is more than twice as high than high school graduates. The annual difference in median pay between a high school graduate and a bachelor’s degree graduate is an astounding $34,112 more ($64,896-$30,784) for bachelor’s degree graduates per year! If for no other reason, graduate with a bachelor’s degree. Maybe you feel a bit like I did. I was simply scared to death of failing and I was a First Generation Student= which is a student who is the first member of their entire nuclear and extended family to attend college or university. I had no idea how to succeed in college and no one in my family who could walk me through it. In fact, when I first started college I was “academically dismissed” for 2 quarters of extremely low grades. That means I flunked out! I came back again after serving a volunteer religious mission. I was older and went to a college that was known for teaching students how to succeed and how to discover their academic strengths and areas that need improvement. One of the most important principles I learned was that colleges and universities are not constantly testing your academic skills everytime you take a quiz, write a paper, or submit and assignment. In fact, most are highly motivated to have as many students as possible complete their programs and graduate. That means they want you to succeed and will often do everything they can to help you figure it out so you do graduate. Another important principle I learned was that there is an entirely different culture of learning in college compared to high school and like any culture you may have to learn if you travel abroad, college and academics has to be learned.
Figure 1 BLS 2019 U.S. Median Weekly Pay by Level of Degree Attainment in 2019*

Another reason to graduate is that the unemployment rates are also much lower for more educated people in the U.S. Figure 2 shows the Unemployment levels by level of degree attained for the year 2018. These barcharts are very clear that the unemployment levels decline dramatically as the educational attainment (degrees earned) increase. Comparing only the bachelor’s to the high school graduates, the unemployment rate is much lower for those with a bachelor’s degree (2.2% unemployed) compared to high school graduates level (4.1% unemployed).
Figure 2 BLS 2018 U.S. Median Unemployment by Level of Degree Attainment in 2019*

A recently published e-article called “Education Pays 2019” identified other benefits to those graduating college (see Ma, J., Pender, M. & Welch, M. (2019) College Board, retrieved 16 July 2020 from https://research.collegeboard.org/pdf/education-pays-2019-full-report.pdf ). The report clearly points out how attending and graduating college or university leads to better: retirement benefits at higher levels, medical insurance, health measures, upward social mobility, healthy lifestyle for family and next generation, higher desirable contributions to society, increased taxes paid supporting society’s infrastructure, and more.
You need education because we live in a credentialed society. Credentialed Societies are societies which use diplomas or degrees to determine who is eligible for a job. The key in the US is to graduate every chance you get: a Certificate=1-year post high school; an Associates=2-year degree; a Bachelor’s=4-year degree; a Masters=another 2-year degree post Bachelor’s; and a Doctorate=another 4-6 years past Bachelor’s degree.
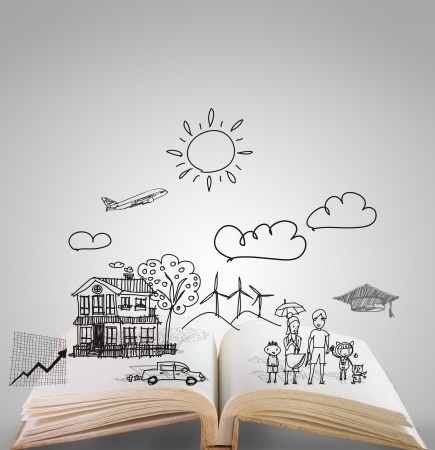
Look at Figure 3 below to see the relationship between higher education levels and the "American dream" or "Ideal" lifestyle. Education is the great equalizer and allows the tradition of college attendance and graduation to be introduced into any individual’s personal and family life experience if they so desire and can muster the personal work and commitment along with the resources needed to attend then graduate. Tens of millions in the US have zero, nada, or no medical or health care coverage. Most of them have lower education levels and little to no college education. The extremely poor and disabled may have limited government coverage, but most poor and near poor have no medical insurance.
Figure 3: How People Get the Best US Jobs
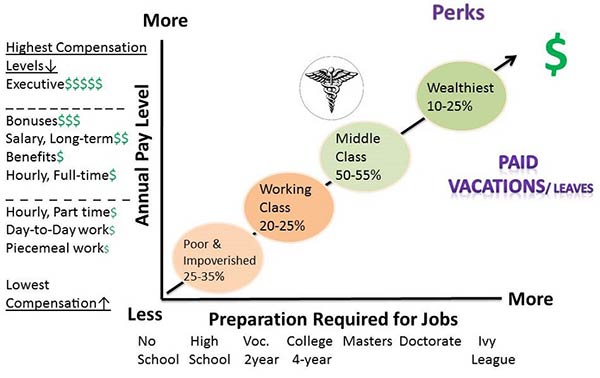
For the most part, working class and middle class people have some level of medical insurance. Interested in a job or career with yearly salary and not hourly pay? Interested in medical benefits and year-end bonuses with paid time off and vacations? Then you need at least a Bachelor’s, Masters or Doctoral degree. Or you may be from the top 10-25 percent of our economic strata that are born into privilege. They get the educational levels, social networking, marriage market, and overall better life chances that only money can buy, including exclusive education, prep-school, admittance into competitive programs, and Ivy League launch pads.
Remember Max Weber’s concept of life chances? Life Chances are an individual’s access to basic opportunities and resources in the marketplace. The very few in our society born into extreme wealth have enormous life chances when compared to the rest of us. Can you run for political office without the proper social connections among the country’s power elite? Probably not. Can you become famous or extremely successful without access to extremely well educated friends and associates who are connected to those corporate owners and board members? Probably not. Can you call a friend and get a huge favor for your children with the understanding that someday you will reciprocate back with a huge favor for their children? Probably not, especially if you were born into an average family.
You may not be able to change your ascribed status of having been born poor or middle class, but you can definitely change the SES of your own family by choosing to attend and graduate from college. You see, compared to most people outside the US, you and I have it better. You even have it better today than most royalty from just 100 years ago. Look at Figure 4 below to compare your average US life today to the life of European royalty back then.
Our Standard of Living
Figure 4. How European Royalty Lived Back Then.
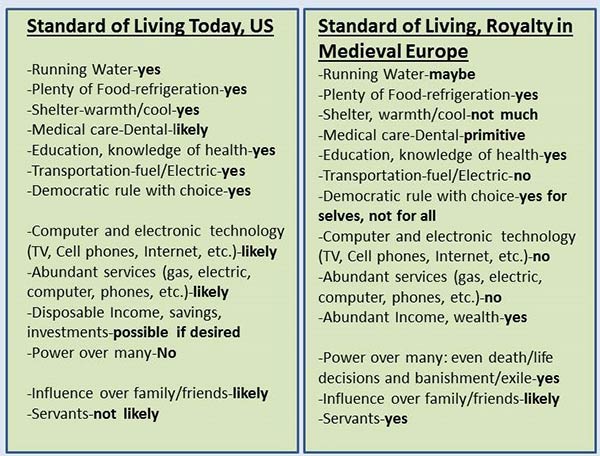
Have you ever toured a medieval castle? Their best accommodations were far better than the average person of their time, but way sub-par in comparison to the average person in our time. You grew up with central heat, running water, electricity, basic health knowledge and medical care, opportunities for 12-13 years of public education that cost you nothing (although your parents paid taxes), all the electronic gadgets you can buy, extra money to save or invest, and a life expectancy that very few royalty dreamed possible hundreds of years ago. Sure, they could control their subjects and servants, even take their lives if they so desired; but, today you can control your personal choices at the personal level and dramatically impact your own and some of your family member’s life course as you see fit.
Take for example one of my students from my Social Problems class back in 1996. To illustrate the personal level of stratification, I was interviewing the students in the class to see how much education and income their parents had, what their own majors were, and how much income they could anticipate after graduation. This way we could estimate their mobility between generations. For the most part my students were from working class backgrounds except one who had a medical doctor for a mother and a banker for a father. Her parents’ income was $2 million higher per year than all the other students.
The very last student in the class, "Julie" was from a family of 9. Her father was a disabled Vietnam War vet who could not hold a job and who had asked a war buddy to let him, his wife, and their 7 children live in his barn. They had only one extension cord, one garden hose, and a port-a-potty. She said she came to our college to become a school teacher and have a steady full-time job with medical benefits. She generously explained how happy she was to have 5 roommates in an apartment.
"I’ll never take another garden hose cold shower if I can help it. Did you know my apartment has 2 bathrooms with tubs and toilets in each? We’ve got a dishwasher, fridge, and electric oven, too." She had the entire class’ attention by now. "Yep, I’ll be a school teacher and when I do I'll help my brothers and sisters go to college…"
Interesting isn’t it? We often take for granted all the luxuries and comforts we have in our modern society and yet, sometimes right next door there are people who don’t have what we have. Julie did graduate and become a school teacher. I have since lost contact with her, but I’m sure she’s settled down and is helping her siblings through college. The point is that she, like all of us, can choose higher education, to graduate, and to acquire for ourselves a larger piece of the American Dream of a comfortable lifestyle and job security. We do this through education.
Measuring Education
In Sociology we measure two distinct types of educational accomplishments: Educational Attainment is the number of years of school completed and Educational Achievement refers to how much the student has learned in terms of reading, writing, and arithmetic. Look at Table 1 to see how attainment typically correlates with degrees.
Table 1: Years of Schooling and Typical Degrees Associated with Them*
| Years | Typical Degree |
|---|---|
| below 12 | Drop out |
| 12 | High School |
| 13 | Vocational Certificate |
| 14 | Associates |
| 16 | Bachelor’s |
| 18 | Masters |
| 20 | Doctorate (Ph.D.; Ed.D. ; JD,; or MD) |
| 21 plus | Specialization or Post-doctoral education |
When students ask me how I feel about taking out student loans I explain the following to them. If you choose to go to college and forfeit full-time wages to become a full-time student you will lose about $126,000 of lost wages while in college. Plus it might cost you another $45,000 in student loans or expenses. So you could conclude that it cost you about $171,000 to earn a 4-year degree. Remember that the median increase in pay a bachelor’s degree graduate earns compared to a high school graduate is $34,112 per year. After working 30 years and earning $34,112 per year that is an increase of $1,023,360 more that bachelor’s degree graduates will earn. Subtract that estimated actual and opportunity cost ($161,000_ from the increased money earned you will likely earn over 30 years (=$1,023,360) and you can see why it pays to attend and graduate with a bachelor’s degree ($1,023,360-$161,000=$862,360 more). Dollar for dollar it pays more and the intitial costs prove to be far lower than the life time return on your investment. But, what if the college or university you want to attend costs way more than $45,000 and you have very little resources from other sources? Simply put, go to a less expensive college or university! Don’t go into debt to earn a “prestigious and expensive degree” when you have little or few resources to pay for it. Do the math here and if the field you want to major in costs way more and pays far less, don’t add to your overall costs by taking out student loans and being strapped with those for the rest of your life.
Consider two real life cases that turned into tragedies for the graduates (NOTE: I actually changed the details of the gender and majors of these students so no one reading these case studies could recognize them. But, they are true as far as the mistakes being made go). In the first case a new high school graduate wanted to be a high school chemistry teacher. She also had a dream to attend the Ivy League University her grandmother and mother attended. But, they each had parents who could pay all the expenses when they attended and they each majored in Home Economics. She decided it was worth it and accrued over $200,000 in student loans before earning her teaching certificate and bachelor’s degree. She found a great school district and they gave her a $15,000 signing bonus to commit to teach chemistry for at least 5 years. She also started at $58,000 per year with medical benefits. Sounds appealing, right? The reality was devastating when her grace period ended and she discovered that her monthly student loan payment was $450 per month ($5,400 per year) for the first year and rose to $650 per month ($7,800 per year) after the third year and for each year until paid off. Those payments have to be made “after taxes” which included: City, State, and Federal taxes. That means they are paid from this graduate’s “take home pay” which was roughly $3,300 per month. She also lived in an area of very high housing and rent costs (She ended up living with her mother, then renting in another city and commuting by rail to work every day. She could have gone to another less prestigious college to earn the same degree and likely landed the same exact job while only accruing $50,000 in student loans. Use the Sallie Mae Student Loan estimation tool which is free online and find out in advance what payments might be like for various loan amounts (SOURCE). Another tip is to go to a less prestigious institution and avoid high student loans and expenses that way. In fact, many online universities offer this same degree today and a student could easily find one that has a similar program and far less costs.
In the second case, a student loved the lifestyle of being a student. He earned his bachelor’s degree (accruing only $29,000 in loans). He graduated, got a great job and eventually got married and started his family. Then he didn’t feel happy at work and decided there was still the whole “graduate school” experience he wanted to have. So, he quit his job and using more student loan debt, he earned his master’s degree then a doctoral degree (accruing $289,000 in total student loans). After graduating with his doctorate, he decided not to work in the field he earned his doctorate in and took a lesser paying job to work with his master’s degree. He told me he would “never be able to pay off his student loans on his income level.” He looked into bankrupting but was surprised to learn that bankrupting cannot erase student loan debt. He applied for and applied for a “hardship” and they were willing to extend his payments another 20 years, meaning he was able to make payments over 40 instead of just 20 years. His mistake (as he tells it) is that his first employer would have paid some or most of his master’s degree expenses while he kept working for them. They also had offered to increase his pay and promote him after graduating with his masters.
Jason Amos (2008) in his study of US dropouts also stated that:
"Individuals who fail to earn a high school diploma are at a great disadvantage, and not only when it comes to finding good-paying jobs. They are also generally less healthy and die earlier, are more likely to become parents when very young, are more at risk of tangling with the criminal justice system, and are more likely to need social welfare assistance. Even more tragic, their children are more likely to become high school dropouts themselves, as are their children’s children, and so on, in a possibly endless cycle of poverty (page 7)."
Truly this is an accurate statement. The US has some of the best educational opportunities for average children to acquire a good public education. But, it lacks cultural motivations that translate across racial and ethnic lines in such a way that education become valued and pursued by average children as a way of opening doors and improving life chances for themselves and their families. It is a paradox in the context of Weber’s life chances, because so many life chances are readily available to average people. Yet, they are refused or ignored by millions.
Amos (2008) also pointed out that high school dropouts from the Class of 2008 will lose $318,000,000,000 in lost lifetime earnings. They will be more likely to be arrested and use welfare for another combined cost of $25,000,000,000 to local and state agencies (page 8). The billions of lost earnings and judicial and welfare costs translate to a lower collective standard of living that could be corrected and improved upon if dropouts would graduate or even go back to earn their high school equivalency diploma GED.
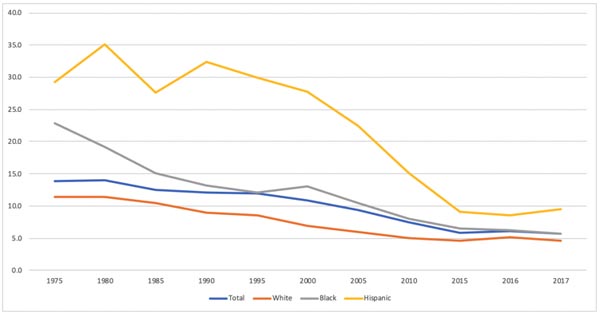
Let’s revisit the dropout data we read in Chapter 2 then add a few dimension of data to it. The worst possible scenario in terms of work and lifestyle is to drop out of high school. The National Center for Education Statistics regularly reports on academic performance. Figure 5 shows the Dropout rates for the US between 1975-2017. The High School Dropout rates ( not graduated or earned a GED nor enrolled in any institution by ages 16-24) has been higher for Whites aged 16-24 than for Blacks and Hispanics since 1975. But in all 3 racial categories, Dropout rates have been steadily declining over the last 45+ years. The declines are far more dramatic for Hispanics who had a much higher Dropout rate than Whites and Blacks.
Figure 5. US Ages 16-24: Status High School Dropout Rate between 1975-2017 (NCES)*
Again, the worst possible scenario in terms of work and lifestyle is to drop out of high school. And millions drop out each year in the US. Table 2 shows the dropout rates by racial classification for the US. Although all racial categories are showing improvement between 2011-2017, American Indians/Native Americans have the highest dropout rate in 2017 (10.1%); followed by Hispanics (8.2%); Blacks (6.5%0; Whites (4.3%); and Asians at only (2.1%). Dropping out of High School adds increased economic challenges through all that income lost; all that lifestyle forfeit; and all those other benefits of higher education missed.
Table 2: Dropout Rates by Racial Classification in the United States 2010-2017*
| Group | 2017 * | 2011 ! |
|---|---|---|
| AM. Indian (Native Am.) | 10.1% | 35% |
| Hispanic | 8.2% | 29% |
| Black (African Am.) | 6.5% | 33% |
| White (non-Hispanic) | 4.3% | 16% |
| Asian | 2.1% | 13% |
The new data we want to consider is regional and state dropout rates. Table 3 identifies the best nine and worst six states for dropout rates in 2016. Iowa was the state leader with only 12 percent of its students dropping out, followed by Vermont and Wisconsin. The District of Columbia had the highest dropouts, followed by Nevada, New Mexico, Georgia, Alaska and Oregon, Florida, Louisiana, then Alabama. If you are considering employment in some of these states, you might want to check out the dropout and or graduation rates the states and for specific school districts within that state. For those who stay in school, there becomes an issue of quality of education. I know it is relatively difficult to define what "quality of education" even means, much less which states or schools get the best quality.
Figure 6 shows a NCES Map of state-by-state dropout rates for 2016. The darker the red hue the worst the dropout rate in that state for 2016. Boarder states showed a pattern of higher dropout rates. The lighter the pink hue the lower the drop out rates. North Dakota and 5 North Eastern states showed a pattern of lowest dropout rates. The rates for these states are listed in Best Six and Worst Six States descending order with rank of state (out of 50) in Table 3. North Dakota had the overall best or lowest dropout rate (2.7%) and Louisiana had the worst (8.7%). These numbers confirm the shading seen in the map in Figure 6.
Figure 6. Percentage* of high school dropouts among persons 16 through 24 years old (status dropout rate), by state: 2016
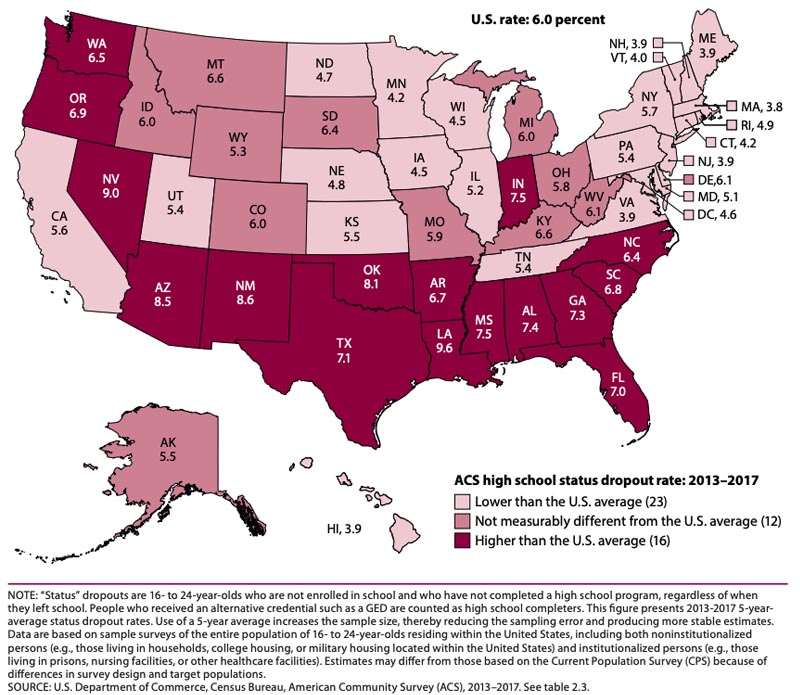
Table 3. Best Six and Worst Six U.S. State Dropout Rates in 2016
| State/Rank out of 50 | Percent Dropout |
|---|---|
| North Dakota/1st | 2.7% |
| Connecticut/2nd | 3.2% |
| Wash. DC/3rd | 3.5% |
| New Jersey/4th | 3.7% |
| Massachusetts/5th | 3.8% |
| New Hampshire/6th | 3.9% |
| < break in the list > | |
| Washington St./45th | 7.5% |
| Arizona/46th | 7.6% |
| Oklahoma/47th | 7.9% |
| New Mexico/48th | 8.2% |
| Nevada/49th | 8.2% |
| Louisiana/50th | 8.7% |
It is a real challenge given that the U.S. spent $739 billion in the 2016-2017 year for public education (K-12). That translated to an average per pupil expense of $14,439/per pupil. In spite of this when compared to 57 other countries, the U.S. spent the 5th highest amount per pupil in 2016. Do the expenditures yield better results? Not really. The 57 countries were compared on actual educational achievement scores or reading math and science at the 4th, 8th, and 10th grade levels. The U.S. did not rank as high as 5th on any of them. For example, the U.S. ranked 16th best on 4th Grade reading scores; 15th best on 4th grade math; 11th best on 4th grade science; 12th best on 8th grade math; and only 11th best on 8th grade science. There are many other examples, but the point is when all 57 countries were compared, the U.S. students ranked closer to the middle than the top of the rankings list (see Hussar, B., Zhang, J., Hein, S., Wang, K., Roberts, A., Cui, J., Smith, M., Bullock Mann, F., Barmer, A., and Dilig, R. (2020). The Condition of Education 2020 (NCES 2020-144). U.S. Department of Education. Washington, DC: National Center for Education Statistics. Retrieved [August 14, 2020] from SOURCE
We can approach quality of education at the personal level. One thing you can try to avoid at your own educational personal level is what is called Bureaucratic Ritualism, or the habit of following the rules and procedures and forgetting the main purpose of the bureaucracy's mission. So often teachers, schools, and school districts become large and they end up trying to meet the needs of 10's of thousands of diverse students and do so fairly.
Between January and May, 2020 the most unexpected world, national, state and community crisis unfolded—the COVID 19 Pandemic. Never before had the faculty, students, administrators, parents, or anyone remotely related to U.S. education experienced a pandemic like this one. Within Days, in-person college and university courses were thrust into the online delivery modality and even though faculty and students did the best they could to adapt, much of it was not very satisfactory to students and to their faculty. A 2020 Article identified the results of 2 surveys conducted specifically about the experiences of faculty and students during the months January to May. The results from each survey clearly indicate that students and faculty reported that it went “okay” but most were disappointed in the end of the academic year. (See Lederman, D. (8 July, 2020) “What Worked This Spring? Well-Designed and -Delivered Courses” Inside Higer Education
This inevitably leads to what educational leaders call Transparency - the creation of rules, regulations, and guidelines to be followed by all students, teachers, and parents. Transparency is a bureaucratic effort to be open, fair, and legally protected. It also creates a culture of a bureaucracy rather than a culture of learning. Students come to feel like a number and not an individual. Students get bored, disheartened, and fall into the daily routines and become somewhat a part of the bureaucracy. This is bureaucratic ritualism and it can be fatal to learning and creativity.

One major effort and reforming and transforming US public education has been the Charter School Movement. Since the early 1990s charter schools have become more and more popular existing in 42 of the 50 US states (See Rebarber and Zgainer (2014) Survey of America’s Charter Schools 2014 retrieved 11 June 2014 from SOURCE ). In 2012 there were over 6,000 charter schools that served a higher proportion of: economically disadvantaged, non-White; and Hispanic students in comparison to public schools. The single most common theme of these charter schools remains college preparation (30% of all charter schools). More recent data suggests an ongoing increase in number and proportion of schools funded by states as charter schools. A 2020 NCES report stated that:
“Between school years 2000–01 and 2017–18, the percentage of all public schools in the United States (defined in this indicator as the 50 states and the District of Columbia) that were charter schools increased from 2 to 7 percent, and the total number of charter schools increased from approximately 2,000 to 7,200.” (see NCES The Condition of Education (May, 2020) “Public Charter School Enrollment” retrieved 16 July 2020 from SOURCE).
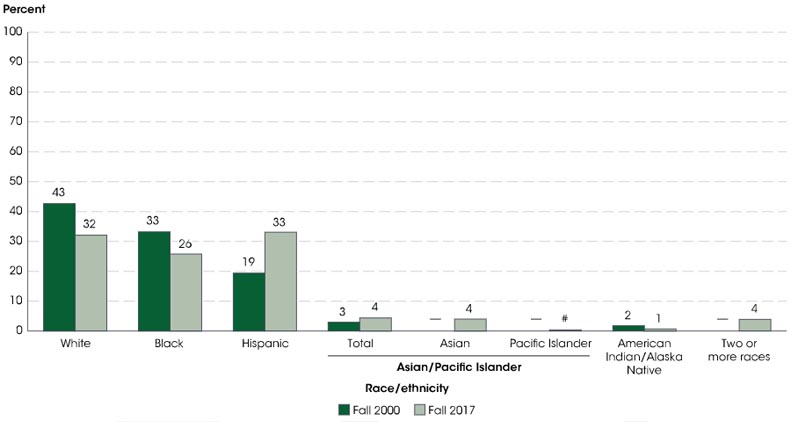
Figure 7 shows the rates of charter school enrollment 2000 and 2017 by racial category. Froom 2000 to 2017 the proportion of Charter school students who were White and Black decreased slightly while the proportion of Hispanic increased. Charter schools account for 3.1 million enrolled students in 2017 and the state of California had the highest number enrolled of all states with a total of 627,000 students. To add further future growth to U.S. Charter Schools, the U.S. Supreme Court ruled in 2020 that it was constitutional for states to fund religious charter schools with public funds (See 30 June, 2020 ruling in Espinoza et al. v. Montana Dept. of Revenue et al. Retrieved 16 July 2020 from https://www.supremecourt.gov/opinions/19pdf/18-1195_g314.pdf ). This will likely lead to increased enrollments as many conservatives have been dissatisfied with public education content for decades leading up to this case and ruling.
Figure 7. Percentage distribution* of public charter school students, by race/ethnicity: Fall 2000 and fall 2017
What Can You Do To Succeed?
As we get closure on the discussion of education we have to focus on the personal level efforts you make toward graduation. The list below is only a few strategies and if you sincerely search at your own institution you will. Likely find others that might work for you.
- See your academic advisor
- Pick a major as soon as possible and set specific goals to graduate
- Attend all classes most of the time
- Ask any question you have (even if it sounds dumb because this is your education and you pay for it which allows you to ask questions)
- Learn to love: learning, gaining new information, and insights
- Visit all your professors during their office hours and get to know how they succeeded in college
- Go to on and off-campus events
- Make a good friend
- Volunteer and do something good for others and tell your parents what you did
- Manage your time, and money as though it were priceless
- 11. Do the math on loans, costs, potential salaries, and desired lifestyles. Consider a less prestigious college if it better supports your goals.
- 12. Take online courses
The Economy In Society
We’ve spoken about how important education is to you and your career and even how important it is to our national economy. Let’s discuss a few concepts about the economy. Economy is a system of producing and distributing goods and services and can be local, state, national, international, and global. There are various types of economic systems in today’s global marketplace. Capitalism is an economy based on the amount of goods and services produced in a free trade setting. Socialism is an economy based on governmental management and control of goods and services.
Communism is an extreme socialistic economy with extreme governmental management of goods and services along with management of public and private ideologies. Cuba, Venezuela, North Korea and China are a few remaining national-level communistic economies. However, China has become the most open capitalistic economic systems among the remaining communistic countries. There are communist parties in many countries today, but few have national control, as do the four above or the many that existed during the Cold War.
Recently many have criticized the US as having forfeited its capitalistic ideals in favor of a form of Democratic Socialism, or an economic system based on the merger of capitalism and socialism that often is accompanied by vague boundaries between governmental management of goods and services and diminished "hands-off" governmental involvement in the individual pursuit of economic stability.
Adam Smith (1723-1790) was an eccentric professor who wrote in The Wealth of Nations that an "invisible hand" emerged when people pursued their own business interest and collectively benefitted society at large. The full impact of Adam Smith’s work is hard to estimate. He is considered to be one of the most intellectually potent thinkers of the last four centuries. His ideas have been taught and have guided national economic policy for decades.
Today’s economy is far different from that of Adam Smith’s. In Adam Smith’s day, much work was located in the Primary sector of the economy. The Primary Sector is the part of economic production involving agriculture, mining, fishing, and materials acquisition. Smith’s day also was laden with work in the Secondary Sector, or the part of the economic production involving manufacturing (factories and home-based). Today, the majority of our work involves the Tertiary Sector, or work which involves providing a service to others such as food, retail, computer processing, or information management. The tertiary sector emerged along with telecommunications and the computer chip technologies (the Three–Sector Theory originated with research by Colin Clark and Jean Fourastié).
In Adam Smith’s day, I’d estimate 2 percent of all work was in the tertiary sector with the rest being in primary and secondary sectors. One recent US Trade report stated that, "Service industries account for 68 percent of U.S. GDP and four out of five U.S. jobs. This dynamic services economy generates the largest services trade in the world, with exports of $606 billion dollars in 2011 and a trade surplus of $179 billion. Services supplied abroad by U.S. affiliates accounted for another $1.1 trillion in revenue in 2010." (retrieved 11 June 2014 from SOURCE
Part of the explanation of why jobs shifted to service-related classifications has to do with supply and demand. Supply is the availability of goods and services in the market place. Demand is the desire in the marketplace for goods and services. Typically with higher supply and lower demand you’d see lower prices. With higher demand and lower supply you’d see higher prices. This is true in many markets, but does not appear to apply to the very unstable US cost of gasoline per gallon which changes without traditional regard to supply and demand.
As the supply of labor-ready employees increased in the US factories and other labor-based industries the demand for these employees appeared to never end. But, as the computer chip transformed technology to the point that less demand for labor became the norm and then workers from all over the world were willing to do the US’s primary and secondary labor for a fraction of the cost, the US literally became an import nation for its primary and secondary goods. Much of the current job market pays and rewards education because education is still in high demand in a service economy. Without it a worker has to compete with cheaper foreign labor or get lucky with the very few labor-related jobs that are in the US economy today.
Additional Reading
Search Internet for:
- mandatory education laws
- cultural capital
- manifest functions
- latent functions
- cultural transmission of values
- inclusion
- social placement
- gatekeeping
- tracking
- hidden curriculum
- self-fulfilling prophecy
- grade inflation
- social promotion
- functional illiterate
- community college
- privilege
- personal merit
- scholastic assessment test
- homeschooling
- mainstreaming achievement gap
- emotional intelligence
- IQ
- "acting white" thesis
- abstract and concrete attitudes
- cultural navigators
- gender gap
- stereotype threat
- standardized testing
- information poverty
- cyberspace
- correspondence principle
- teacher-expectancy effect
- credentialism
- Meritocracy
- Inequality in Education
- Cumulative Advantage
- Habitus
- Tyhe Coleman Report
- The Bell Curve
- Tracking
- Hidden Curriculum
- US Dept. of Education LINK
- National Center for Educational Statistics LINK
- ACT Test Corporation LINK
- College Board or SAT Corp. LINK
- Wikipedia on Homeschooling LINK
- Home Schooling Advocacy LINK
- National Charter School Resources LINK
- United Nations Education First LINK
- US Treasury Dept. LINK
- Federal Reserve Education Page LINK
- Stanford Institute for Economic Policy research LINK
- Congressional Budget Office LINK
- Bureau of Labor Statistics LINK