
Chapter 09 - Stratification
Stratification and the Three P's
Did you ever live in a home where the basement was really cold and the upstairs was hot? I did while growing up; we had cold layers of air in the basement and warmer layers upstairs. I didn't know it at the time but when layers occur in nature it is called stratification. Layers occur almost everywhere in nature: in tissues of the human body, rock formations in the ground, atmospheres around the earth, and in societies of every nation on the earth. We call these layers strata and the process of layering stratification. Societies have stratification, too.
Social Stratification is the socio-economic layering of society's members according to property, power, and prestige. Property is all the wealth, investments, deeded and titled properties, and other tangible sources of income. Power is the ability to get one's way even in the face of opposition to one's goals. Prestige is the degree of social honor attached with your position in society. As things go, those with lots of property tend to also have lots of power and social prestige. Those with less property tend to have less power and prestige.
The key concept of this chapter is that there are layers of social stratification in every society, nation, and even at the global level-there are the "haves" who coexist with the masses or "Have nots." Does this remind you of Karl Marx and Max Weber? It should. They focused heavily on wealth and poverty in the complex social systems of their day. In our current social world there are a very few who are extremely wealthy and very many who are extremely poor.
Wikipedia has a page called “The World’s Billionaires” based a great deal on Forbe’s annual report which keeps a relatively updated list of the world’s billionaires. For 2018 Wikipedia stated:
“In 2018, there was a record of 2,208 people on the list, that included 259 newcomers mostly from China and the U.S.; there were 63 people under 40 and it had a record number of 256 women. (see https://en.wikipedia.org/wiki/The_World%27s_Billionaires retrieved 8 July 2020).”
In contrast the US Census Bureau reported that 38,100,000 live in poverty in the U.S. (See Semega, J. et al. (10 Sep 2019 “Income and Poverty in the United States: 2018” P60-266 retrieved 8 July 2020 from SOURCE ). The number has decline dramatically since 2015 when it was 43,100,000 (See Bernadette, D. et al. (13 Sep 2016 “Income and Poverty in the United States: 2015” P60-256 retrieved 8 July 2020 from SOURCE ). Also in contrast the World Bank released a News Brief stating that in 2018 “nearly half the entire world’s population lives on less that the equivalent of $5.50 US Dollars per day.” That included 3,400,000,000 people! (see World Bank 17 Oct. 2018 “Nearly Half the World Lives on Less than $5.50 a Day” retrieved 8 July 2020 from SOURCE ).
These billions of people still experience hunger, poverty, preventable illness, early deaths, and famines and wars. In a reference we use often in this textbook, you will find the Population Reference Bureau's World Population Data Sheet can be very enlightening in this discussion.
The PRB uses a measure of relative economic well being called the GNI PPP. The GNI PPP is the gross national income of a country converted to international dollars using a factor called the purchasing power parity. In other words this lets you understand how much a person could buy in the US with a given amount of money, regardless of the country's currency. It lets the United Nation and Population Reference Bureau have a common value to compare countries with when they look at international stratification issues. The 2012 estimates include key information from the World Bank.
The higher the GNI GDP the better off the average person in that country. Look at Table 1 below to see GNI GDP Score values for selected countries and regions of the world in 2018. Wikipedia has another page listing Bank GINI Index data for the world in a variety of years. The US ranks high $62,808 GDP per capita (per person) but is the 8th wealthiest. Contrast that to Burundi’s score of just $272 GDP per year. There were a total of 15 countries in 2018 with <$1,000 GDP Scores. You can already see that there is clear evidence of stratification at a global level.
More Developed Nations are nations with comparably higher wealth than most countries of the world including: Western Europe; Canada, United States, Japan, and Australia-these are also called Now Rich Countries. More developed nations are often referred to as “high income nations” which had a gross per capita national income in excess of $12,616 in 2012 (Atlas dollars see ). Less Developed Nations are nations located near to or south of the Equator which have less wealth and more of the world's population of inhabitants including: Africa, India, Central and South America, most island nations, and most of Asia (Excluding China)-these are also called “Now Poor Countries”. China ranks high among now poor country and is on a path to become more like the high income nations. But, because of its central control over wages, currency values, and other factors, the per person income continues to score much lower than we see in many currently high income nations. China has surprised many analysts and may yet surprise experts in creating policies to pay the average worker a higher wage and support personal income increases in other policy strategies.
Table 1. Selected GNI GDP for Countries and Regions of the World
| Country | GINI GDP |
|---|---|
| Luxembourg | $117,312 (High Income Nation) |
| United States | $ 62,208 (High Income Nation) |
| China | $9,532 (Rapidly emerging into higher income nation) |
| Guyana | $4,979 (Now Poor Country) |
| Kenya | $1,711 (Now Poor Countries) |
United States Layers-Strata
The U.S. has always experienced stratification. Look at Figure 1 to see the general upward trend in median income for all races especially from about 2016 and later. You can see the grey vertical shaded bars that represent the years of economic recession. Income declines during recessions. The 2008 recession took a financial toll on every country worldwide, and especially took a heavy toll on the poorest people in the U.S. and World. But, even in 2018 notice the layers with Asians, Whites (non-Hispanics), Hispanics, then Blacks (data were not available for Native Americans). Asians had a median income of $87,194 contrasted to Blacks at $41,361(That equals $45,833 more for Asians).
Figure 1. A Comparison of the US Median Household Income by Race and Hispanic 1967-2018*.
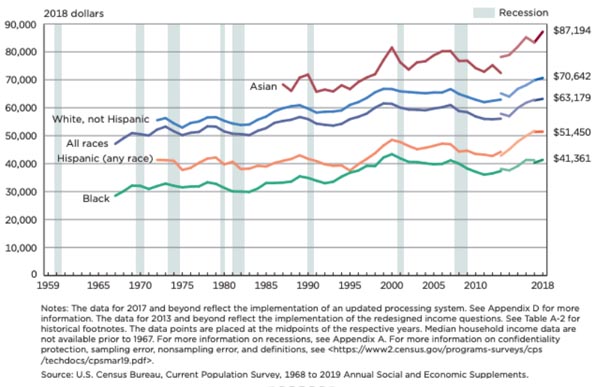
Inflation happens when the general cost of goods rises while the general purchasing power of a country’s currency is declining. These dollars are multiplied by a number that converts them all to having the same buying power as 2018 dollars. That conversion is often calculated using a value called the Consumer Price Index (CPI) or the weighted average rise or fall of certain types of goods within an economy (such as medical care, food, and transportation). When income is adjusted to a standard value in a given year (say 2018), it is called controlling for (or adjusting for) inflation.
Figure 2 shows a comparison of earnings of men and women between 1959 and 20189 (in constant 2018 dollars). In the US, men have always earned a higher median income in comparison to women but the gap in income has be narrowing slightly since about 1980 with an increase in narrowing starting about 1995. The thick line on the top of this diagram indicates that the ratio of female-to-male median income was up to 81 percent meaning that women have a median of 81 cents earned for every one dollar men earned. This is often used as evidence that the system refuses to acknowledge the value women in the workforce. That may be true by many measures. By Federal and State laws it would be illegal to discriminate against the protected class of men or women. A variety of contradictory studies have claimed a variety of sources of “evidence” that it is and others it is not wide-spread discrimination. Their studies and sources of “evidence” are compelling, yet contradictory. Wikipedia has a page with a concise over view of the current themes in these claims (see SOURCE ).
Figure 2. Female-to-Male Earnings and median Earnings in the US 1960-2012 (2018 dollars)*
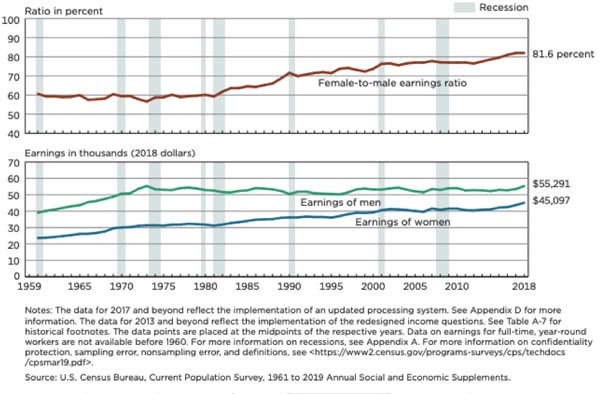
Figure 3 shows the number and percent in poverty in the US between 1959-2018. In 2018 there were 38.1 million living in poverty representing 11.8 percent of the population. A few trends in this line graph indicate some larger social trends that have happened in the U.S. For example, the drop between1959 and 1979 when jobs were abundant and the economy was doing moderately well. After the 2008 recession there was a dramatic increase which has since declined again. It might take years to see how the pandemic impacted these trends, but one can expect that it would likely increase not decrease the numbers and percentages in poverty.
Figure 3. Number and Percent of people living in Poverty in the US from 1959-2018
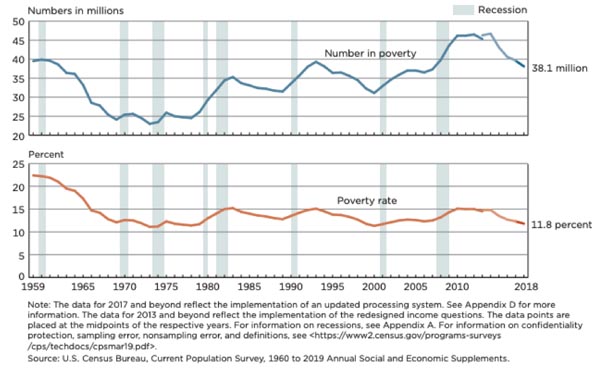
Figure 4 begins to show you at least 1 reason why the layers look the way they do in society. As we will discuss later in Chapter 14 on education, dropping out of high school hurts your income and overall socio-economic well-being. The dropout rate has been declining since 2000, especially for Whites, and Blacks and to a lesser extent Hispanics (Asians and AM. Indian/Native Americans were not included in this NCES report). The worst possible scenario in terms of work and lifestyle is to drop out of high school. And millions drop out each year in the US. Table 2 shows the dropout rates by racial classification for the US.
Although all racial categories are showing improvement between 2011-2017, American Indians/Native Americans have the highest dropout rate in 2017 (10.1%); followed by Hispanics (8.2%); Blacks (6.5%); Whites (4.3%); and Asians at only (2.1%). Dropping out of High School adds increased economic challenges through all that income lost; all that lifestyle forfeit; and all those other benefits of higher education missed. Dropping out is a dead end personal income buster that hurts the individual, community, and society at large. Dropping out is a very bad economic choice. But, not all economic disadvantage results from our choices. Here are some general patterns found in U.S. society: non-Whites, non-Asians, and non-males are more likely to be found in the lower layers.
Figure 4. US Ages 16-24: Status High School Dropout Rate between 1975-2017 (NCES*)
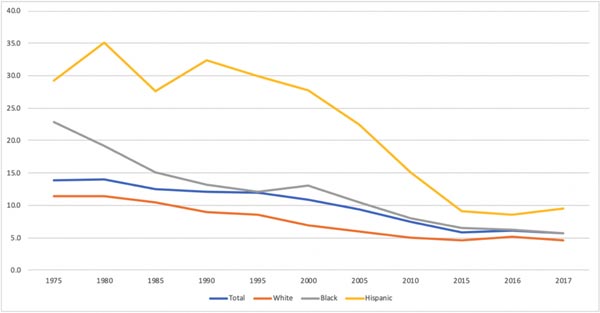
Table 2. Dropout Rates by Racial Classification in the United States 2010-2017
| Group | 2017* | 2011$ |
|---|---|---|
| AM. Indian (Native Am.) | 10.1% | 35% |
| Hispanic | 8.2% | 29% |
| Black (African American) | 6.5% | 33% |
| White (non-Hispanic) | 4.3% | 16% |
| Asian | 2.1% | 13% |
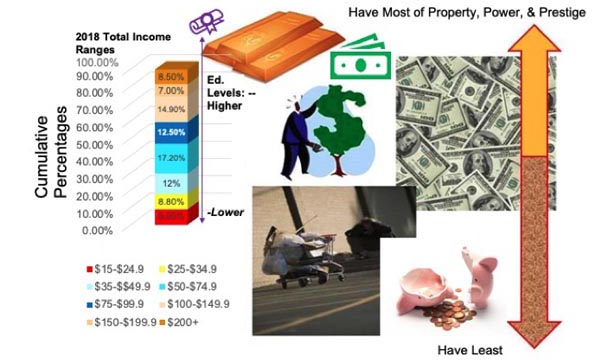
Figure 5 portrays what the layering of society looked like using actual U.S. Census Bureau 2018 data found as well as some highly correlated factors that can influence U.S. stratification (Retrieved 9 July 2020 from Table A-2 Total Income…. SOURCE U.S. Census Bureau, Current Population Reports Semega, J. et al. (Sept. 2019). “Income and Poverty in the U.S.”, 2018, P60-266 (rev) U.S. Government Printing Office, Washington, DC. ). Using the same data source from Figures 1-3 Figure 4 is shows the 2018 Total Income categories for 2018. The total of the top three categories indicates that there were 30.4 percent who had incomes at $100,000 or higher. This 30 percent is likely what C. Wright Mills called the “Power Elite. They are typically born into existing wealth, receive much higher education K-12, attend much more prestigious universities, and find the best paying most prestigious jobs after finishing their education. The middle 3 categories represent the Middle 41.5 percent in 2018. They likely have a vocational or college degree. They likely work in sectors that pay well, but would never advance them up the income level to rank among the wealthy elite. In the lowest two categories, there were 17.7 percent who had less than $35 total income in 2018. These would likely include high school dropouts, single parent households, disabled, and those who would qualify for various forms of welfare assistance.
For a relative few they make more in a year than most of us make in a lifetime. Theirs' is the life of high levels of the 3 Ps. In Table A-4 of the same source it states that the top 5 percent richest in the U.S. Population have 23.1 percent of all the total national income and the top 20 percent richest (including top 5% richest) has a staggering 52.0 percent of all the national income in 2018. That means the other 80 percent of us have only 48% of the 2018 total national income. They hold the high ranking jobs, run for elected office, and run the major corporations in CEO-level positions. These types of jobs: pay more; require more education; require more abstract thought; and allow for more self-directed, autonomy in their daily activities.
Figure 5. Portrayal of United States' Economic Layering
Understanding Poverty and Near Poverty
The US has an official definition of being poor or in poverty. The Poverty Line is the official measure of those whose incomes are less than three times a lower cost food budget. Many of the Federal and State welfare programs use these poverty guidelines for qualification criteria used to access welfare. Although $40,090 is a great deal of money, it would be difficult to support a family of 8 on it in 2014. This definition has been the US 's official poverty definition since the 1930s with only a few adjustments. Near Poverty is when one earns up to 25% above the poverty line. Table 3 shows the 2020 minimum poverty threshold for family sizes ranging between 1-8 and the Near Poverty minimum thresholds for the same family sizes. Although $44,120 is a great deal of money, it would be difficult to support a family of 8 on it in 2020. This definition has been the US 's official poverty definition since the 1930s with only a few adjustments. We would say that a person near poverty has an income below 125% of the current poverty line. Most who qualify as living below poverty also qualify for state and federal welfare which typically include health care benefits, food assistance, housing and utility assistance, and some cash aid. Those near poverty may or may not qualify depending upon current state and federal regulations. That means a family of 8 people could receive welfare benefits if their income level fell between $44,120 and $55,149. A family of size 8 would not qualify if the total family income was $55,150 or more and no food, medical, or other welfare benefits would be provided.
But, the losses hurt the lower layers of the economic strata sometimes to the point that they fall below the ability to sustain their families. Absolute Poverty is the level of poverty where individuals and families cannot sustain food, shelter, warmth, and safety needs. Those below poverty are already in a bind. For example, the average home where I live in Utah costs way more than the average family could afford. Not being able to find suitable housing is correlated with many other social challenges for families.
Table 3. US Poverty Guidelines 2014 With Near Poverty Estimates*
| Number of People in Family | Poverty Line | Near Poverty Estimates <125% of Poverty Line |
|---|---|---|
| 1 | $12,760 | $15,950 |
| 2 | $17,240 | $21,550 |
| 3 | $21,720 | $27,150 |
| 4 | $26,200 | $32,750 |
| 5 | $30,680 | $38,350 |
| 6 | $35,160 | $43,950 |
| 7 | $39,640 | $49,550 |
| 8 | $44,120 | $55,149 |
There are differences among economic systems in which people live and have opportunities. This brings up a very important concept from Max Weber. Life Chances are an individual's access to basic opportunities and resources in the marketplace. Not all of us have the same life chances as others. For example, one of my best friends in high school came from a wealthy family. Her father was a neurosurgeon and they had many resources that myself and others like me didn't have. When I went to college, I was the first ever on either my mother or father's side to go to college. I had no financial aid, no family support, and such bad high school grades that I had no scholarship funding. My friend on the other hand had a new car, new Apple computer, all expenses paid apartment and living costs. She and I had very different life chances from one another. She earned her Master's degree and I earned my Ph.D. I only received help once from my father with a car repair bill (he gave me this as a graduation present). I worked numerous part-time jobs and eventually got my GPA high enough to earn a scholarship, and later graduate assistantship. I also had to take out thousands in student loans.
But, even I had far greater life chances than most people in the world today. So do you. The United Nations has the multiple ongoing Millennium Development Goals. To achieve these or any other standard of living improvement goals is difficult when the wealthy power elite in countries and in the world continue to see their income levels sharply increase while most in the world and in their countries see only modest gains. Efforts to shift income gains, especially to the poorest 3-5 billion people in the world, could benefit the quality of life of so many. Their life chances could be improved under the right circumstances. As you can see, life chances vary from house to house, state to state, region to region, and nation to nation. It also clarifies your understanding of stratification to look to the nation's economic system.
Measuring Economic Systems: Class and Caste
The United States has an open class system of life chances and opportunities in the market place.
An Open Class System is an economic system that has upward mobility, is achievement-based, and allows social relations between the classes. India has a closed caste system. A Closed Caste System is an economic system that allows no mobility between caste levels: you are born into the caste you stay in your entire life, and you can't have social relations between the castes. India has a highly structured caste system which has 5 distinct cast layers called: Brahman (Priests or scholars); Kshatriya (Nobles and warriors); Vaishva (Merchants and skilled artisans); Shudra (Common laborers); and Harijan (Outcast/dirty workers).
In India you typically are born into a caste and that is your destiny for life. This was basically true up until the 1980s when multinational corporations began to set up various types of business enterprises in India. Western corporations hired thousands and thousands based upon their personal skills and achievements (a class trait in the West). The Indians have experienced cultural disruptions because talented individuals have worked their way above higher caste members in the organizational structure. We find similar violations of caste rules here in the US where Indians who migrate here find themselves with many opportunities. Their life chances increase by virtue of their being able to shift residence from a caste to a class society.
Sociologists like to study how people improve, diminish, or leave unchanged their economic status-we call this Social Mobility means the movement between economic strata in a society's system. There are a few key types of mobility. Upward Mobility means moving from a lower to higher class. Downward Mobility is moving from a higher to a lower class. Horizontal Mobility is remaining in the same class. We can compare mobility between or within generations of family members. Inter-generational Mobility is the research of mobility between generations (IE: grandparents to parents to grandchildren to great-grandchildren).
Just list the occupation your grandparents, parents, and you have and rank them by property, power, and prestige. This is a measure of inter-generational mobility at your personal level. Intra-generational Mobility is the research of mobility within a generation. Just compare your property, power, and prestige between you and your brothers and sisters (this might even work for comparisons between you and your cousins).
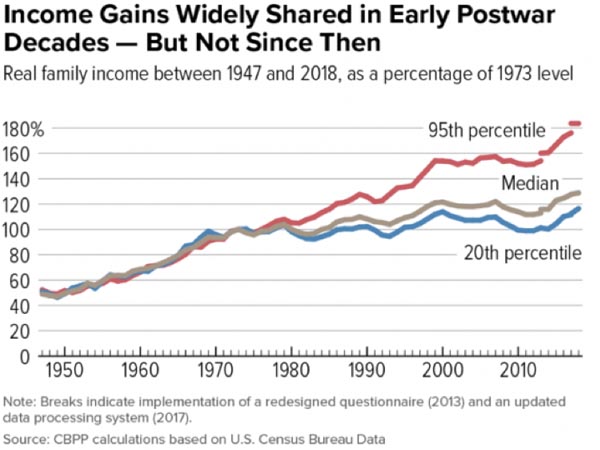
Structural Mobility is mobility in social class, which is attributable to changes in social structure of a society at the larger social, not personal level. The United States has experienced collective upward social mobility for the entire nation over the last 60 plus years (See Figure 6 below). Upward structural mobility can be identified in Figure 7 below. Yet, in the U.S. certain portions of the US society are experiencing more upward mobility than others.
The Congressional Budget office reported that between 1979 and 2007, the US after tax income grew 275 percent for the top 1 percent of the richest people; 65 percent for the next 19 percent richest; 39 percent for the people who feel between the 21-60 percent richest category; then rose only 18 percent for the US’s poorest poor or lowest 20 percent (retrieved 19 June 2014 from Trends in the distribution of household income between 1979-2007 SOURCE ). A More recent online report indicated a similar patter that continues up until 2018. Figure 6 shows the Income gains between 1950 and 2018. It is clear that almost everyone saw increases in their income during the exceptional years of prosperity starting in 1950. But, after about 1980, the richest 5 percent saw the most dramatic income increase gains in comparison to everyone else.
Figure 6 shows the Income gains between 1950 and 2018
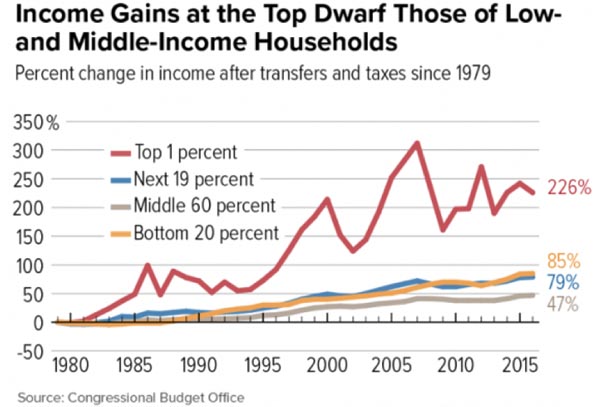
The Middle Class are defined as those between the upper class and poorer class members of society. This sounds fairly concise and accurate, but there is also a subjective component to being middle class—your values and aspirations. Many middle class want their children to graduate college build for a retirement, buy a nice home, buy a nice car, and take their family on a few vacations. Surveys find that many Americans define themselves as belonging to the middle class, even if they have low or higher levels of income (See Cashell, Brian W. "Who are the Middle Class?" CRS Report for Congress. October 22, 2008 and Middle Class in America SOURCE ). In Figure 7 below the income gains between 1980 and 2018 are shown. The Bottom 20% had a 85 percent increase in income. This should have been something to celebrate, but the percentages and numbers of those in poverty persist at high levels. A family in the very lowest levels of poverty who has an 85 percent increase may still find themselves far below the poverty threshold. The middle 60 percent shown likely represent the middle class. They only saw a 47 percent gain. At the same time the Top 1% saw a 226% gain and the next 19 Top percent saw a 79% gain. Many argue that the middle and lower classes are being exploited by society’s elite.
In Figure 7 below the income gains between 1980 and 2018 United States
Sociologists who focus on stratification typically use official data to measure the layers. This is what is called the Objective Method, where researchers set up categories and rank people according to preset objective criteria (such as median household income). Sociologists also talk to people or ask their opinions about the layers and how they perceive their fit into the economic strata.
The Reputational Method is where researchers look to people who know the individual and subjectively report on his/her class. We ask them to answer a survey question such as "which class best fits your current economic situation? __Rich, __Middle, __Working, or __Poverty Class". Notice the absence of numbers in the reputational method.Yes, there are layers in society. Through sociology’s theories and statistical style you can begin to better understand how they develop and how they are perpetuated in various forms both within and between countries. It is tempting at times to blame poor people for their circumstance and judge others who have fewer life circumstance than we have from our personal perspective. A Mills Sociological Imagination suggest, it is much wiser to consider both the larger social and the personal levels.
Additional Reading
- There is an interesting report on empowering women economically free on the United Nations webpage.LINK.
- The United Nations set up 8 Millennium goals to reach by 2015 LINK
- meritocracy
- Davis-Moore thesis
- capitalist
- proletarians
- alienation
- blue-collar occupations
- white-collar occupations
- socioeconomic status
- conspicuous consumption
- feminization of poverty
- slavery
- bonded labor
- indentured service
- ideology
- endogamy
- apartheid
- estate stratification system
- social mobility
- proletariat
- class consciousness
- false class consciousness
- meritocracy
- divine right of kings
- first world
- second world
- third world
- world system theory
- globalization of capitalism
- culture of poverty
- neocolonialism
- multinational corporations
- structured inequalities
- slavery
- occupation
- Marx means of production and the analysis of class
- Weber class and status
- means of production
- surplus value
- pariah groups
- status
- Davis and Moore functions of stratification
- Erik Olin Wright contradictory class locations
- Annette Laureau on parenting styles
- contradictory class locations
- upper middle class
- lower middle class
- upper class
- middle class
- working class
- lower class
- underclass
- intergenerational mobility
- intragenerational mobility
- exchange mobility
- relative poverty
- working poor
- feminization of poverty
- children in poverty
- the elderly in poverty
- homeless
- Kuznets curve
- culture of poverty
- dependence culture