
Chapter 14 – Aging and Families
What Is Gerontology?
The United States of America is inhabited by many diverse people, including distinguishable generations of society's members based on age. Gerontology is the scientific study of the processes and phenomena of aging and growing old. The definition of being elderly varies. For example, the government typically sets 65 to be the elderly years, the American Association of Retired Persons finds 55 to be the eligible age of membership, and many elderly define their 70's or 80's as the time they begin to feel elderly. Gerontology is multi-disciplinary with medical and biological scientists, social scientists, and even financial and economic scientists all studying the processes of aging from their discipline's point of view.
Social Gerontology is the sociological sub field of gerontology which focuses on the nonphysical and social aspects of aging. Sociology focuses on the broad understanding of the elderly experience, their health, their emotional and social wellness, and their quality of life, just to mention a few. How many elderly lived in the US in 2014?
Table 1: Numbers and Percent of United States Eldery Population (Aged 65+), compared to 3 Other Categories of Ages 2019/2014 with Number and percent changes*
| US Elderly (65+) | 64-18 Years old | 17-5 Years old | 4-0 Years old | U.S. Total |
|---|---|---|---|---|
| 54,159,521 | 200,882,589 | 53,503,042 | 19,694,371 | 328,239,523 |
| 16.50% | 61.20% | 16.30% | 6% | 100% |
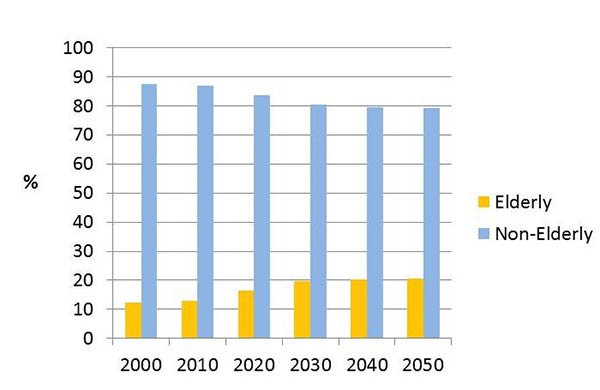
How much future growth is estimated for the U.S. elderly? The future growth of the US elderly population is immense in comparison to previous Census tabulations and growth rates. In Figure 1 below you see tremendous future growth in the United States where the elderly now comprise only 1 in 8 members of US society, but in 2050 will comprise 1 in 5. How does that happen? Part of how that happens is that current U.S. elderly and near elderly (those turning 65 no later than the year 2029) had fewer children per couple than did their parents. Then their own children had fewer children than the current elderly and near elderly did when they were younger.
Figure 1: Estimated percentage of US population that will be Elderly and Non-Elderly, 2000-2050*.
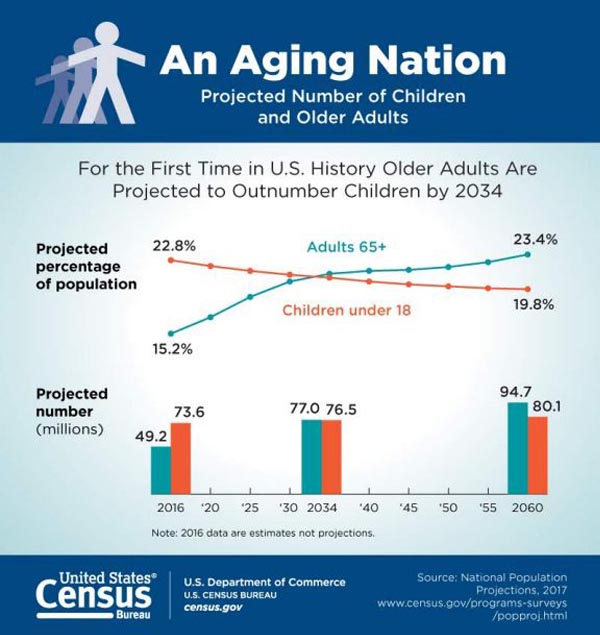
In Figure 2 you can see a graphic created by the U.S. Census Dept. in 2019 showing the reducing numbers of children with the simultaneously increasing numbers of elderly in the U.S. The year, 2034 is the year the U.S. has more elderly than children. In short, we have fewer working age, retirement tax-paying, younger members of society than is needed to support the costs of retirement benefits to the elderly.
Figure 2. U.S. Census Image* of Increasing Percentages and Numbers of U.S. Elderly and Decreasing Percentages and Numbers of U.S. Children (2016-2060)*.
In Figure 3 below you can see that the oldest old, 85 years and older, is also growing rapidly. This means that in general more people are living longer. In fact there are more centenarians than ever before. A Centenarian is a living person who has had their 100 birthday. US Census counts indicated about 37,000 centenarians in 1990 and about 50,000 in 2000 (Retrieved 28 May 2014 from https://www.prb.org/age100andcounting/ ). A 2020 U.S. Census report estimated that the U.S. sub-population of elderly will grow to be about 250,000 people by the year 2060-that’s a growth rate of Centenarians of 618% between 2016-2016! (Vespa, J et al (March 2018/revised February, 2020 retrieved “Demographic Turning Points for the United States: Population Projections for 2020 to 2060”, Table 1. Population by Age Group: Projections 2020 to 2060 P25-1144 retrieved 13 July 2020 from SOURCE).
In many societies the elderly are revered (especially Asian societies). Filial Piety is the value, respect, and reverence of one's elderly which is often accompanied by care giving and support of the elderly. In Western countries (like the U.S.), the elderly and their extended family are considered co-equals and mutually independent until circumstances necessitate assistance from children and other family members.
Figure 3: Estimated percentage of US population that will be 65-84 and over 85, 2000-2050*.

Understanding the Generations of Life
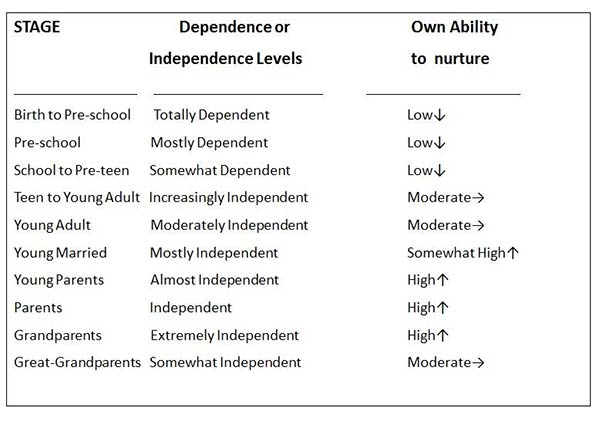
Before we can take a serious Social gerontology approach to the larger social trend of increased elderly in the U.S. we need to first understand a few key concepts. A Life Course is an ideal sequence of events and positions the average person is expected to experience as he/she matures and moves through life. Dependence and independence levels change over the life course. In Figure 4 below, you can see that from birth to teen years, that children's levels of dependence are relatively high and our levels of independence are relatively low. Newborns have little ability to nurture others, but as they are socialized and grow into their later-teen roles things change. By young adulthood, independence is a prime value which leads many to move out on their own and gain their own experiences (like most of you did).
A young adult's ability to nurture is moderate, but often dormant since most pursue avenues of preparation for their adult lives rather than immediately beginning their own families. Married and cohabiting couples are much more independent and capable of nurturing and remain so throughout the grand-parenting years. As the life course progresses into later life, the oldest elderly begin to lose their independence as their health declines to the point that their resources lag behind the daily demands placed upon them. This is because all of us experience senescence. Senescence is the social, emotional, biological, intellectual, and spiritual processes associated with aging.
Figure 4: Diagram of Dependence and Independence Over the Life Course
For many in our modern societies, aging is feared, vilified, and surgically and cosmetically repaired. We do not like being "off our game" and senescence is viewed as a weakness. Yet, many elderly find their lives very satisfying. And they tend to report higher levels of self-esteem than do younger members of society. Because we tend to value youth, youthful appearance, and youthful-centered entertainment, biases appear in the US. There are, in the United States, many who hold deeply held biases and prejudices against the elderly. Ageism is the prejudice and discrimination against a person based on his/her chronological age.
Ageism is a unique form of bias. One may be prejudiced against another racial group, cultural or ethnic group, or religious group while never being at risk of becoming a member of that group. Ironically, ageist people are aging right now and will be until the day they die; they are essentially biased against their own future status.
Theorizing Later Life
For those who seek understanding of the elderly, there are three social theories that might help to understand the elderly and their later-life experiences. These are listed in order of their professional value by Gerontologists who study aging-related psychosocial issues.
The Continuity Theory claims that older adults maintain patterns in their later years which they had in their younger years. The elderly adapt to the many changes which accompany aging using a variety of effective personal strategies they developed earlier in their life. For example, those who participated in outdoor activities in their younger years tend to continue to do so as older adults, although they tend to accommodate their health and fitness limitations as they deem appropriate.
The Activity Theory claims that the elderly benefit from high levels of activities, especially meaningful activities that help to replace lost life roles after retirement. The key to success in later-life is staying active and, by doing so, resist the social pressures that limit an older person's world. (Google Robert Havighurst and Aging).
The Disengagement Theory claims that as elderly people realize the inevitability of death and begin to systematically disengage from their previous youthful roles, society simultaneously prepares the pre-elderly and elderly to disengage from their roles. This was the first formal aging theory that fell short of credibility because the scientific data did not support its assumptions. There is quite a bit of support for Continuity and Activity Theories (see The Encyclopedia of Aging).
To really understand the elderly today you have to understand the larger social changes that have transpired over the last century. Around 1900, US elderly held a more cherished place in the hearts of younger family members. Most homes were intergenerational with grandparents, parents, and children all living in the same home and more often with kin on the wife's side being the social connection around which 3 generations would live (see Dorian Apple Sweetser, 1984 "Love and Work: Intergenerational Household Composition in the U. S. in 1900" Journal of Marriage and the Family, Vol. 46, No. 2 (May, 1984), pp. 289-293 retrieved on 18 June 2008 SOURCE ).
The family structures that were very common a century ago are not nearly as common today. In the U.S. around the year 1900 most families had three generations living in one home (i.e., children, parents, and grandparents). In 2012, only 5 percent of all US household had multi-generational family members living in them (retrieved 6 June 2014 from SOURCE America’s Families and Living Arrangements: 2012, P20-570). A Recent PewResearch report estimated that there were 64 million Americans living in multigenerational households in 2016 ( see Cohn, D. & Passel, J. S. (5 April, 2018) “A record 64 million Americans live in multigenerational households.” Retrieved 13 July 2020 from https://www.pewresearch.org/fact-tank/2018/04/05/a-record-64-million-americans-live-in-multigenerational-households/ ). Why so many in 2016? Simple, the adult children ages 25 and older have the highest percentage of any known generation in the U.S. of still living in their parents homes. The report stated “…those ages 18 to 34, living with parents surpassed other living arrangements in 2014 for the first time in more than 130 years...about a fifth live with multiple generations under one roof…ages 55 to 64 (24% in 2016) and 65 and older (21%).”
Most of us don’t live in the same home as an elderly relative. Not having older relatives live in your home probably feels normal, however, the point is that in years past elderly family members were considered a valuable asset with their wisdom and support of their children and grandchildren. Today, most in the U.S. prefer allowing their elderly family to live in another location than their own residence (so do most elderly prefer this arrangement).
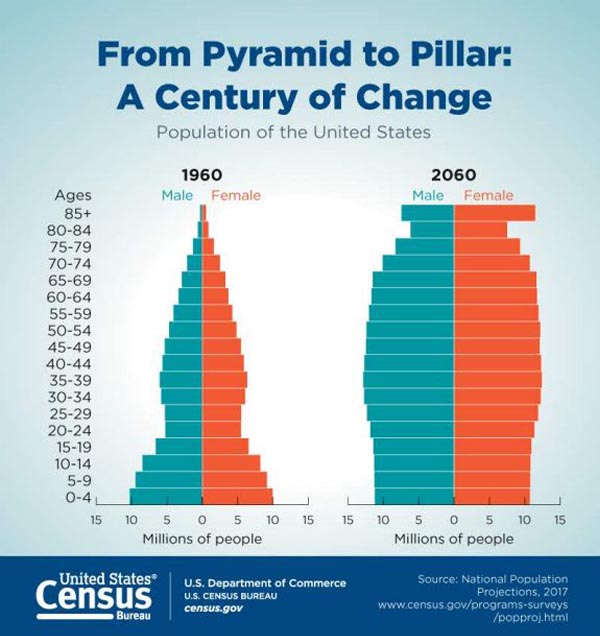
In this textbook we will use a few examples of population pyramids. A Population Pyramid=the graphic representation of specified 5-year age groups within a population and by being males or females. Sometimes these are shown in numbers and sometimes in percent composition of the population. Figure 5 shows the dramatic increase in the older members of society and how that increase literally changes the shape of the 1960 U.S. population pyramid which is somewhat shaped like like a pyramid; into more of a “pillar” shape by the year 2060. Look at the categories in the 2060 pyramid from ages 66 and older. By 2060, any remaining Baby Boomers (born between 1946-1964) still alive will be ages 95 and older. The narrow top seen in the 1960 pyramid was there because there was a much higher percentage of younger members of U.S. society and much lower percentage of 65 and older members.
Figure 5. Population Pyramids for the United States, 1960-2060 (in millions)
The final gerontology theory to consider is called Modernization Theory= claims that industrialization and modernization have lowered the power and influence which the elderly once had and that this has lead to much exclusion of elderly from community roles. Even though this theory is not as well established and is somewhat controversial, it has made a place in science for understanding how large-scale social forces have impacted the individual and collective lives of the elderly. In our modern societies: the economy has grown to a state that has created new levels of prosperity for most; the new technologies have outpaced the ability of the elderly to understand and use them; and the elderly are living much longer and are not essential to the economic survival of the family as was the case for millennia. Modernization can help us to understand why the elderly have become stigmatized and devalued over the last century.
Generations: Young and Old
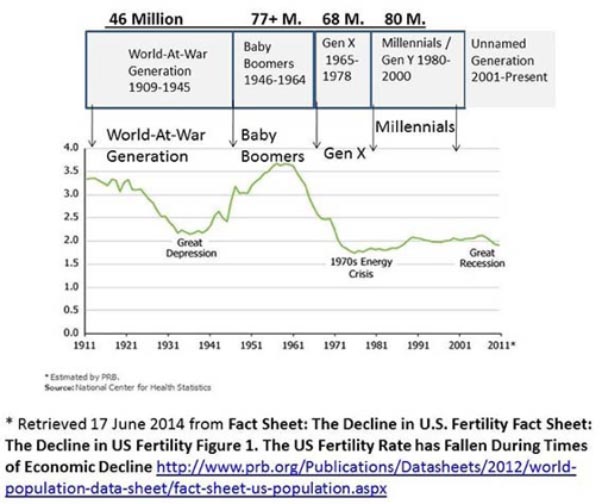
Who make up the generations of our day? Look at Figure 6 below to see the Total Fertility Rate from 1911-2011 with overlapping generations and headcount estimates of their 2014 numbers.This figure appeared in a previous edition of this textbook and was kept because it showed a generational comparison, unique up to that point in U.S. history. The Total Fertility Rate (TFR) is defined as the number of children the average woman has in her lifetime. The TFR rates declined with the Great Depression until 1946 (the commencement of the Baby Boom). The Baby Boom represented a surge in birth rates that persisted from 1946-1964 and declined to pre-Boom rates in 1965. Generation X or "Gen X" represents the children of the Baby Boomers which spilled into Generation Y or the "Millennials" which by most accounts were born between 1980 and 2000 (plus or minus a year or two on the start and finish dates). There is also a new generation emerging which has yet to be named because its members have not yet grown old enough to compare and contrast their traits to previous generations and identify their unique qualities.
Figure 6. Total Fertility Rate US 1911-2011 with 2014 Headcount Estimates of Five US Generations
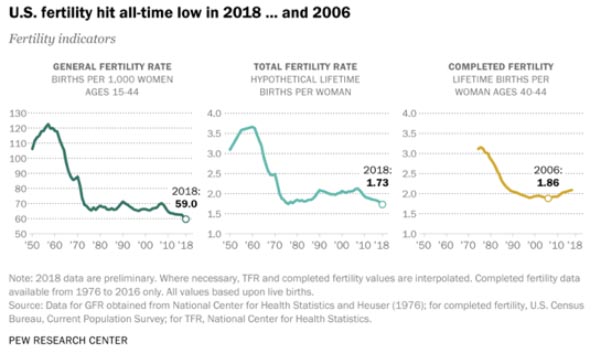
The World-At-War Generation is slowly disappearing from the US population landscape. On the 18th of June, 2008 the last living Veteran of World War I was honored by the White House and Congress. Frank W. Buckles fought in WWI and was held prisoner in Manila during World War II (see CNN, retrieved on 19 June, 2008 from http://www.cnn.com/2008/US/03/07/war.veteran/ ). "According to the 2012 U.S. Census brief, Veterans age 65 or older numbered in excess of 12.4 million" (Retrieved 28 May 2014 SOURCE). The General Fertility Rate (GFR)= number of births in a year per 1,000 women ages 15-44. Completed Fertility=the total number of children a woman had in her life time (typically by ages 44 or slightly thereafter. A May 2019 PewResearch Report identified how 3 powerful measures of U.S. Fertility between 1950 and 2018 indicate that the U.S. Fertility has hit an all time low (see PewResearch Livingston, G. (2019). “Is U.S. fertility at an all-time low? Two of three measures point to yes.” Retrieved 13 July 2020 from SOURCE ). Figure 7 Shows these Trends in remarkable detail indicating that the trend previously identified in Figure 6 continue persistently as of 2016. The article reports that these trends are due to a number of factors including: declining birthrates, the great recession of 2008, delayed age at marriage, long-term educational attainment, and women’s labor force participation trends. Since many women of childbearing ages have not yet reached the age of measuring their completed fertility, time will tell if all three rates confirm ongoing record low U.S. fertility rates.
Figure 7. PewResearch Graphic of GFR, TFR, and Completed Fertility of U.S Women 1950-2018
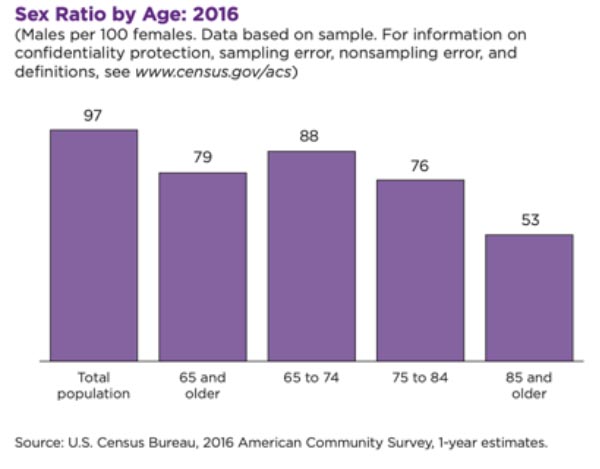
Sex Ratio is the number of males per 100 females. The 2014 US 65 years and older sex ratio was 75.4 males/100 females (Retrieved 17 June 2014 from Appendix Table A-3 SOURCE ). Figure 8 shows the Sex Ratio of the 49.2 million U.S. Elderly in 2016. Overall in the ages 65+ category there are only 79 males per 100 females. In the ages 65-74 there are a few more at 88 males per 100 females. In the 75-84 category there are only 76 males per 100 females. And finally in the 85+ category there are only 53 males per 100 females. Clearly, the older the age category, the lower the sex Ratio
Figure 8. U.S. Sex Ratio For Elderly Ages 65 and Older with Various Age Comparisons
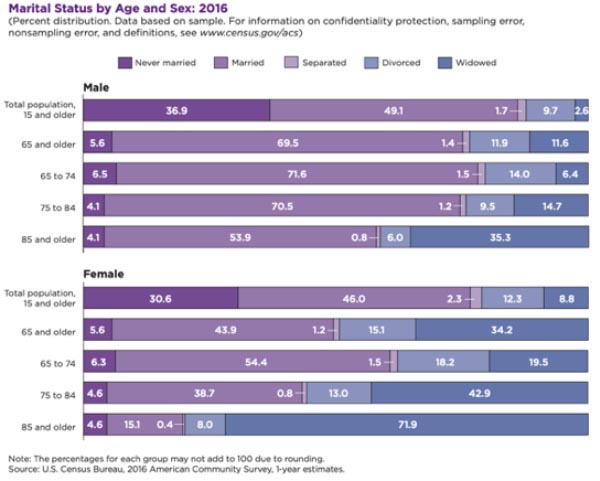
From the same 2018 report we see a variety of marital statuses and living arrangements for elderly males and females as of 2016. Figure 9 shows these 2016 counts The Census report stated that only 6 percent of elderly females and 6 percent of elderly males had never married. This is quite the contrast to the 31 percent of females ages 15-64 and the 37 percent of males ages 15-64 who had never married (page 5). Notice that for the 65-70 year old elderly divorced there was a higher percentage of elderly divorced (14.0% males and 18.2% females) than is found in the two oldest age categories of elderly ages 75-84 (9.5% males and 13.0% females) ages 85 (6.0% males and 8.0% females). Notice also that the elderly ages 65 and older had higher percentage divorce (11.9% males and 15.1% females) than did those ages 15-64 (9.7% males and 12.3% females). Why? The Baby Boomer elderly (who in 2016 would be between ages 65-74) divorced more than any generation before or since (discussed in more detail in Chapter 13). And the younger generations are marrying less than any generation before them. Finally, notice more divorced females than males at all ages. In general, divorced males remarry sooner after their divorce than females.
Figure 9. Marital Status and Living Arrangement difference in U.S. Elderly males and Females as of 2016
In 2019 the United Nations released a report on the World’s Elderly. Table 2 shows the actual and future estimated numbers of elderly ages 65+ for 2019 and 2050. There are an astounding 702,900,000 (702 million) elderly in the world in 2019 but by the year 2050 there will be even more at 1,548,900,000 (1.5 billion). That is an increase of over 846 million! Table 2 also provides percentage changes between 2019 and 2050. Notice also that the greatest increase in numbers of elderly are not coming so much from the wealthier nations in Europe and North America (only 48%), Australia or New Zealand (only 84%). Many are coming from Sub-Sahara Africa (218%), Northern Africa (226%), Central and Southern Asia (176%), Eastern and South-Eastern Asia (120%), Latin America and Car. (156%), and Oceana (190%). The elderly in the poorer regions (where more children are still being born than in the wealthier regions) are living longer than previous generations lived.
Table 2. Number of persons aged 65 years or over by geographic region, 2019 and 2050
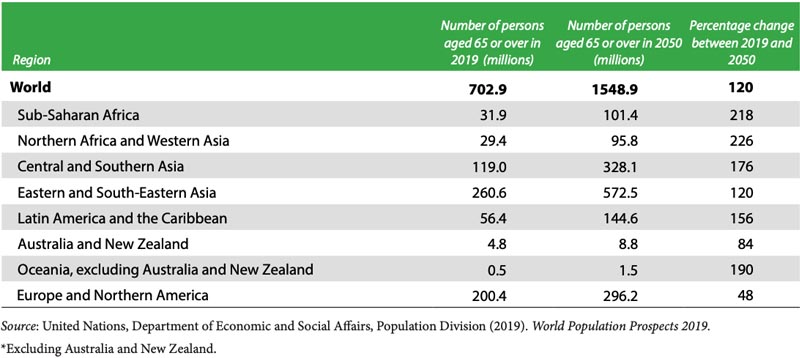
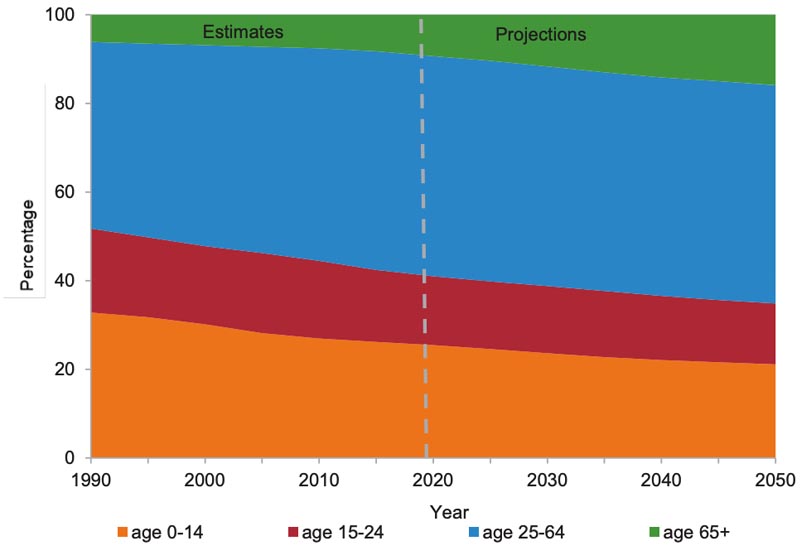
Figure 10 shows a chart diagraming the various age groups in the world between 1990 and 2050 with percentages by age categories. This chart allows you to visually see the world-level larger social trend of increasing proportions of world’s elderly population. Notice the reduction over time of the youngest two age categories ages 0-14 and 15-24. These have been shrinking because of worldwide efforts to reduce the number of children women give birth to. Because these efforts have been as successful as they have, because our elderly worldwide live longer than elderly did in the past generations, and because of increasing educational opportunities for females; fewer children will comprise the world population in 2050 than did in 1990.
Figure 10. Global population by broad age groups, 1990-2050 (percentage)
A Cohort is a group of people who share a statistical or demographic trait such as those born between 1946-1964. Nearly 10,000 Baby Boomers turned 65 each day in 2014 and should continue at that rate until 2029 (retrieved 17 June 2014 from AARP "Boomers @65". The Baby Boomers represented 73 million U.S. citizens as of April 2019. This large cohort of society's member is moving en mass into the ranks of the elderly. The US Census estimates that 57.8 million baby Boomers will be around in 2030 after they've all retired. One issue for gerontologist is the financial strain the Baby Boomers will place on the rest of society once they are retired. Most speculate that baby Boomers will not receive the same from the Social Security Administration benefits that their parents and grandparents enjoyed. retrieved 14 July 2020 from U.S. Census Bureau
The children of the Baby Boomers were called the Generation X children or the "Baby Bust" because they were born in post-Boom low fertility rate years. They were different from their parents. They grew up with the computer age and came to computer technology much like an immigrant comes to a new country. This cohort grew up in an economic state of greater posterity than did previous generations. Generation Y, or Millennials, are also called the "Internet Generation" or "Screenagers" because they grew up with TV, video games, cell phones, PDAs, and movie screens (see Youtube video narrated by a PEW researcher named Paul Taylor http://www.youtube.com/watch?v=k0mw7Vp0tYI ). Each generation is culturally distinct compared to the previous ones even though much still remains in common. There is a good chance that children of Generation Y parents will be better skilled than their parents with a technology that has not yet been invented. Such has been the case comparing the last three generations.
The newest generation that followed Gen Y Millennials is now called the “Generation Z=the generation born after 1996 that includes the only generation born with “Smart phone” technology abundantly available. The newest Canadian and U.S generation to be identified has been called “Generation Z.” They are estimated as of 2020 to include 24+ million people in the U.S. alone (PewResearch, Parker, K. & Igielnik, (14 May, 2020) “On the Cusp of Adulthood and Facing an Uncertain Future: What We Know About Gen Z So Far.” R. retrieved 2 July 2020 from SOURCE ).
Unlike the Millennials, Gen Z grew up in the difficult 2008 Recession and have gone through a COVID 19 Pandemic during their young adult years. Pew reported that unlike previous generations, Gen Z is “Members of Gen Z are more racially and ethnically diverse than any previous generation, and they are on track to be the most well-educated generation yet. They are also digital natives who have little or no memory of the world as it existed before smartphones.” It should be mentioned that there is no governmental or educational organization that has the authority to define what makes up a generation. Pew’s recent report is typical, but if you search the Internet for other sources of definitions for “Generation Z” don’t be too surprised if they vary. A 15 year old Gen Z young woman gave a very insightful TEDxASL talk 31 October 2019 about the larger social trends that are isolating the human experience with technological advancements. (see Bella Muri “Class of 2022” called “Gen Z and the end of our Humanity | Isabella Muri | TEDxASL” retrieved 14 July 2020 from SOURCE ).
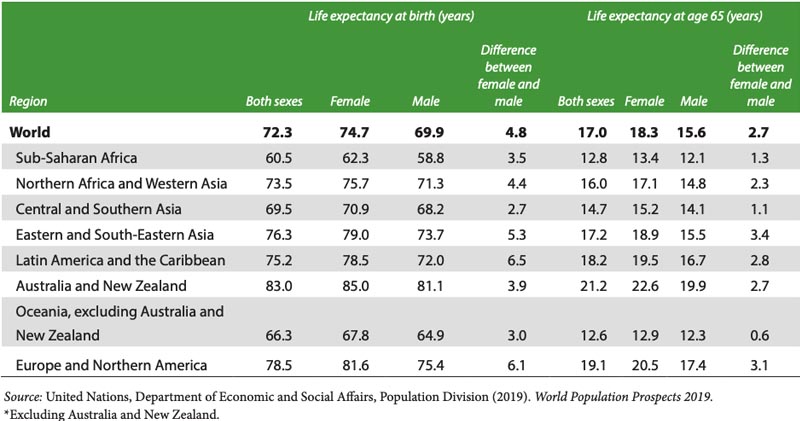
These Gen X, Y, and Z generation members and their world-wide counterparts will likely see that females in their age groups outlive males. Generally speaking, this is true for almost every age category in the world. Females of all ages in most countries of the world, have a higher life expectancy than men. Life Expectancy=is the average numbers of years a person born today may expect to live. Table 3 shows the 2015 to 2020 U.N. data on life expectancies by world region. Worldwide, females out live males on the average of 4.8 years (Life expectancy of females was 74.7 years and males only 69.9 years). Latin America and the Caribbean and in Europe and Northern America regions where the females out live the males by 6.5 and 6.1 years respectively. If females and males live to be age 65 their life expectancies (see right hand columns in table) are all higher for females and males. That means females outlive males from birth, to age 65, and older.
Table 3. Life expectancy at birth* and at age 65 by sex, world and regions, 2015-2020 (years)
Many of the now adult children of U.S. elderly are finding a larger social trend that no one anticipated they would experience. This trend has developed over the last 30-45 years and is now replacing as much foster care as states can arrange to replace. It’s called Kinship care which means care giving provided by grandparents, other relatives, or even friends, without the direct support of the child’s parents. Many non-White US subculture groups have practiced kinship care over the last few centuries. But, it has only been recent that the majority White families have been practicing it. Hong et al. (2011) reported that in terms of formal and informal foster care, kinship "care placement has increasingly become a preferred form of childcare arrangement" (Hong, J., Algood, C.L., Chiu, Y., and Lee, S. A. (2011). An Ecological Understanding of Kinship Foster Care in the United States. Journal of Child & Family Studies, 20(6), 863-872, p.863).
Langosch (2012) estimated about 2.4 million grandparents nationwide who were raising about 6 million grandchildren, representing a 50 percent increase from 1995-2005. Bissell and Miller (2012) reported that 26 percent of all state-supervised children in the US are cared for by Kin. Kinship caregiving costs the government less money that traditional foster caregiving. Langosch (2012) reported that kinship caregivers save the government billions of dollars every year (Langosch, D. (2012). Grandparents Parenting Again: Challenges, Strengths, and Implications for Practice. Psychoanalytic Inquiry,32(2), 163-170). Strom and Strom (2011) reported that in the United States it cost states an average of $22,000 for a foster care child and only $4,000 for a kinship child’s annual support (Strom, P. D. & Strom, R.D. (2011). Grandparent Education: Raising Grandchildren. Educational Gerontology, 37(10), 910-923).
A recent report, published by the Annie E. Casey Foundation stated that the trend of diverting children who otherwise have been placed in foster care into kinship care has saved billions of dollars in care giving cost to state and federal governments. But at what cost? Many kinship care givers refuse to seek professional help and professional resources because they might be ashamed and because they might be protecting the child’s parents. If the kinship caregiver does not seek help outside the family, then none of the vast community resources (grants, medical care, therapy, education, caseworker evaluation, etc.) can be obtained for the family.
Oversight is needed if we truly want to provide children with the best placement experience. (For more information, see The Kinship Diversion Debate: Policy and Practice Implications for Children, Families and Child Welfare Agencies by the Annie E. Casey Foundation ). In spite of this concern, recent scientific studies have documented the relative quality of children raised in kinship care giving compared to foster children and others. (See recent studies: Hong, J., Algood, C.L., Chiu, Y., and Lee, S. A. (2011). An Ecological Understanding of Kinship Foster Care in the United States. Journal of Child & Family Studies, 20(6), 863-872 and Winokur M, Holtan A, & Valentine D. (2009). Kinship care for the safety, permanency, and well-being of children removed from the home for maltreatment. Cochrane Database of Systematic Reviews, 1, 1-122.)
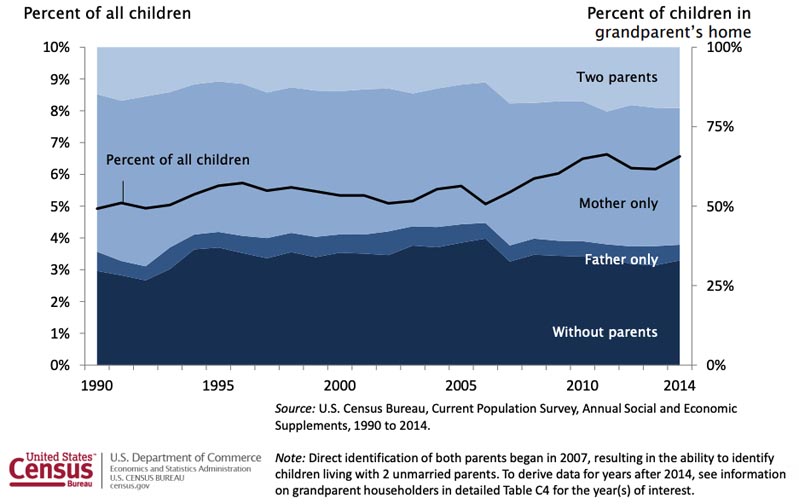
In the U.S. in 2014 there were approximately 73,692,000 children. Many were being raised in their grandparent’s home, some with a father, mother, both, or neither. Figure 11 shows the trend of which type of living arrangements U.S. children who live in the home of their grandparents experience between 1990 and 2014. This figure has percentage vales on both sides of the vertical axis. On the left, you see the percentage of all children growing up in their grandparent’s home which is about 5 percent in 1990. Look at those children in the lowest category called “Without parents.” They represent exclusively the situation where their grandparent or grandparents are providing kinship care for them. Those shows that all the research cited above and the trends between 1990 to 2014 indicate steady larger social trends of grandparents providing kinship care.
Figure 11. Presence of parents for children living in the home of a grandparent
As mentioned, elderly women outlive elderly men. What happens when a spouse dies? Widowhood occurs when one's spouse dies. Widows are surviving wives. Widowers are surviving husbands. For the most part gerontologist expect to see more widows than widowers both in the US and the entire world.
As a young college student you probably don't worry about ever being a widow or widower. Justifiably, you shouldn't have to based on statistical probabilities. In fact, you are more likely to lose a spouse via death than via divorce. Do some math with me. If you are female and marry a guy 2 years older, and he typically dies 5-6 years before you, then you will be a widow at some time in your life and may live 6-8 years as such. One sub-discipline of gerontology is thanatology. Thanatology is the scientific study of death and dying. Thanatology informs those who provide support and counsel to the dying.
How we define death, both our own and the death of others, is very much influenced by the cultural definition of death we incorporated into our own values while growing up. Most of us are related to someone who died in the last 24 months. It's very common for college students about your age to have lost a great aunt/uncle, great grandparent, and even a grand parent. It's not so common for you to have lost you own parent or sibling. Grief is the feeling of loss we experience after a death, disappointment, or tragedy. When you experience grief you are said to be in bereavement. Bereavement is a name for the circumstances and conditions that accompany grief.
Dr. Elisabeth Kübler-Ross published her work as the stages of grief. These include: denial - "All is fine, or it didn't happen;" anger - "why me? Or I hate God for this;" bargaining - "I'd be a better person if you (God) will just let him live;" depression - "all is lost, or why try?;" and/or acceptance - "we'll be okay or we can get through this together" (see "On Death and Dying," 1973; Routledge Press).
I've noticed that we all grieve when things disappoint us, when someone dies, when we are disappointed, when we hear of tragic news, or even when we break up with someone. I've seen my seniors grieve to a certain degree when they did not get into graduate school on their first try. We all grieve and we all grieve in our own way. Studies show that most people experience denial, anger, bargaining, depression, or acceptance, but there exists some disagreement on the part about cycling through Kübler-Ross' stages in any order.
The study of aging, the study of generations, the study of life course, and the study of death and dying are part of the social gerontology approach. Courses and degrees are offered throughout the US and abroad and there are many professions where gerontologists work throughout their careers. Since there are still Baby Boomers who are reaching age 65, there will be higher and higher percentages of divorced males and females. Since females remarry less after divorce and after widowhood, there will likely be more female unmarried (widowed, Separated, and Divorced) than males. Women who have never married and anticipate their future dependence on their own work history and retirement tend to have a better retirement in place than elderly women who were once married. Since so many U.S. elderly are moving into retirement ages, the federal government is finding that there is not enough work tax revenue to meet the growing demand and many fear a lowering of benefits or the increases in FICA taxes taken out of everyone’s paycheck. This means many elderly currently do not and likely will not have adequate resources to allow them to retire.
In 1935 when the Social Security Act and federal agencies that support the Social Security (and later Medicare) programs were made into law, a Social Security Trust fund was set up to hold reserves for elderly who had paid enough money into the program and earned a retirement benefit. That fund exceeded $2 trillion dollars up until around the Recession of 2008 and then the federal government borrowed it and now pays the fund interest on the loan they took out against it. The Government accounting office predicted in 2015 that the Trust Fund would be depleted by the year 2033 unless changes are set into place to tax or benefit in different ways (see Social Security Trust Fund Cash Flows and Reserves by David Pattison Social Security Bulletin, Vol. 75, No. 1, 2015 retrieved 14 July 2020 from https://www.ssa.gov/policy/docs/ssb/v75n1/v75n1p1.html ).
Add to that the trends of the Baby Boom surge of children followed by the rapid decline in births after 1964 have created a surplus of elderly needing to draw upon their retirement benefit and a short fall of adequate numbers of younger workers paying their FICA taxes from which retirement funds can be drawn. Please understand, national deficits are higher than ever before, economic damage from recent pandemic and other disasters have permanently damage the economy, and many elderly simply can’t retire until many years after age 65. What do they do? Simply put, they must keep working.
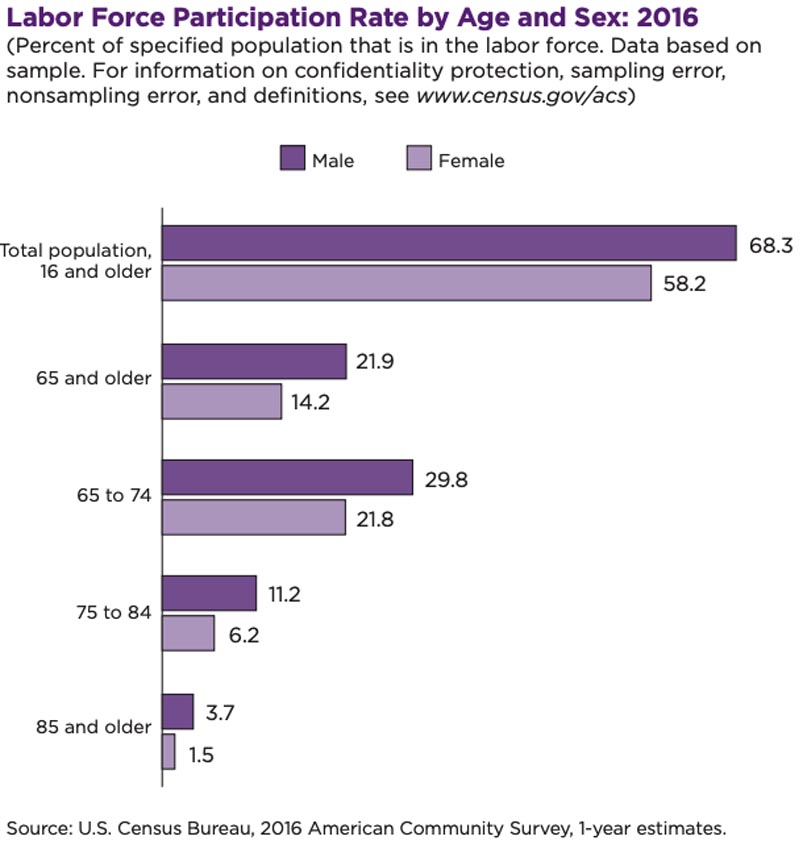
Figure 12 shows the labor force participation of age categories in the United states for 2016. For the age category 65-74 we see that many elderly are still in the labor force (29.8% males and 14.2% females) . For the age category 75-84 we see that there are fewer in the labor force (11.2% males and 6.2% females) and finally for the 85 and older there are far fewer still in the labor force (3.7% males and 1.5% females). One has to wonder if these percentages will increase in coming years.
Figure 12. Labor Force Participation Rate by Age and Sex: 2016
Roles of Grandparents
The role of grandparent is a socially acceptable one in the U.S. It is admired by others, bragged about by grandparents, and more often than not appreciated by grandchildren. Grandparents are given social approval by peers and society in general for being in that role. Grandparents also can be as actively or inactively involved as they desire. There are varying types of grandparental involvement, and I've developed a few types just for comparison purposes here. Most U.S. grandparents live in another household from their grandchildren. But economic uncertainties and demographic changes with lower birth rates may contribute to the U.S. returning to three- or four-generational households (see Pew Research Center: Social and demographic Trends, Monday Feb. 11, 2008 "US Pop. Projections: 2005-2050 by Passel and Cohn).
The "Disneyland Grandparents" entertain and distract their grandchildren from the mundane aspects of their daily lives at home. These grandparents provide a certain entertainment option that is missing for the children's not-yet established parents. Grandchildren come to have high expectations of indulgence when spending time with these grandparents.
The "Assistant Parent" grandparent is the one who takes the grandchildren to school functions, practices, and doctors’ appointments or waits for the grandchildren to come to their house after school and before the parents return home from work. Because the parents are typically both employed, these grandparents sometimes become an integral part of their grandchild's daily life and have an ongoing supportive role in the grandchild's busy schedule. Many young dual-employed couples could not afford the cost of formal daycare, and many grandparents feel rewarded by the meaningful contribution they make in this role.
The "Parental Substitute" grandparent is the one who lives in the home with the grandchild (or the grandchild lives in the grandparent's home). This is an older family member who is drawing retirement, depends heavily on Medicare for their medical expenses, and is typically in declining health. These grandparents have a great deal of stress that often reminds them of the original parental stresses they faced when they were raising their own children. The Parental Substitute grandparents often express fatigue and feeling overburdened.
Raising grandchildren is not what most grandparents anticipated to happen in their later lives. Grandparents in the U.S. often have direct daily interaction with their grandchildren. The U.S. Census Bureau estimates over 7 million grandparents do have their grandchildren living in their home (retrieved 13 June 2014 SOURCE ). This type of grandparent is common when unwed teen mothers keep their babies, when an adult child is divorced or widowed, or when a child or son/daughter-in-law becomes disabled.
Finally, there is the "Distant Relative" grandparent. These grandparents visit at times and live at a geographic or emotional distance from their grandchildren. They typically can't or will not have a close relationship with the grandchildren. Telephones and the Internet allow these grandparents to consult with the parents and be intermittently involved in the lives of their children and grandchildren, but many grandchildren experiencing this type of grandparenting often report a disconnect to these grandparents.
Grandparents can have a positive and nurturing impact on their grandchildren, or they can have a shameful and negative one. Some grandparents work diligently to reinforce the value of each individual grandchild, often trying not to repeat the same mistakes they made when raising their own children. These grandparents find ways to show and express their love, support, and valuation of the grandchild.
Other grandparents repeat the shameful patterns of parenting that they mistakenly used in their own parenting efforts. They label grandchildren and shame them as a form of control and discipline. When asked this question, "If you had to use a negative or positive symbol to portray how your grandma or grandpa views you, which would it be and why?", grandchildren will indicate to some degree the nature of their relationship to their grandparents and how they perceive a low esteem that these grandparents have for them.
Elder abuse is a significant problem in modern U.S. families. I will give you just a short mention of it in this chapter so you can contemplate some of the facts, and in chapter 16 I'll cover family violence and tragedies in more detail. Elder Abuse is the mistreatment of, violence against, and otherwise harmful manipulation of elderly persons. Marlene Lee (2009) reported that elderly abuse is too common (retrieved 10 February 2010 SOURCE ). She reported that fewer than 10 percent of U.S. elderly are abused in any way, and that verbal abuse was the most common form. She also reported that non-family persons accounted for more than half of all elderly abuse. When a family member was verbally abused, it was more likely to be from a spouse. Financial and physical abuse were more likely to be inflicted by a child.
Additional Reading
Search the keywords and names in your Internet browser
Grandparents Raising Grandchildren (Without the help of the parents) SOURCE
Grand H.E.L.P. for Grandparents Raising Grandchildren Colorado State U. SOURCE
Help for Grandparents and other Relatives Raising their relative’s children SOURCE
Kids Matter Inc. – Kinship Care Wisconsin SOURCE
IFAPA – Iowa’s foster, adoptive & kinship care families resources SOURCE
National Resource Center for Permanency and Family Connections – Kinship Care SOURCE
Adoption by Family Type: Kinship/Relative Families SOURCE
National Kinship: Alliance for Children – The GrandKin Guide SOURCE
Raising Grandchildren: Support from AARP SOURCE
Children’s Defense Fund – Kinship Care Resource Kit SOURCE
Generations United – Grandfamily Resources SOURCE
Grandfamilies – Resources SOURCE