Chapter 02 - Sociological Imagination
Seeing the Social World In A New Light: Personal & Larger Social
The average person lives too narrow a life to get a clear and concise understanding of today’s complex social world. Our daily lives are spent among friends and family; at work and at play. We spend many hours watching TV and surfing the Internet. No way can one person grasp the big picture from their relatively isolated lives. There are thousands of communities, millions of interpersonal interactions, billions of Internet information sources, and countless trends that transpire without many of us even knowing they exist. What can we do to make sense of it all?
When I learned of the sociological imagination by Mills, I realized that it gives us a framework for understanding our social world that far surpasses any common sense notion we might derive from our limited social experiences. C. Wright Mills (1916-1962) was a contemporary sociologist who brought tremendous insight into the daily lives of society’s members. Mills stated that "neither the life of an individual nor the history of a society can be understood without understanding both" (Mills, C. W. 1959. The Sociological Imagination page ii; Oxford U. Press). Mills identified "Troubles" (personal challenges) and "Issues" (Larger social challenges) that are key principles for providing us with a framework for really wrapping our minds around many of the hidden social processes that transpire in an almost invisible manner in today’s societies. Before we discuss personal troubles and larger social issues, lets define a social fact.
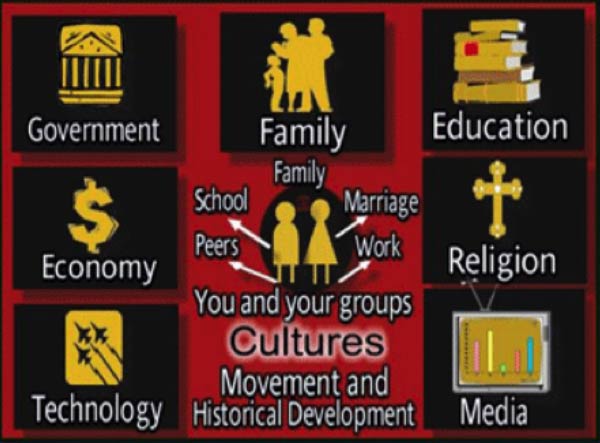
Social Facts are social processes rooted in society rather than in the individual. Émile Durkheim (1858-1917, France) studied the "science of social facts" in an effort to identify social correlations and ultimately social laws designed to make sense of how modern societies worked given that they became increasingly diverse and complex (see Émile Durkheim, The Rules of the Sociological Method, (Edited by Steven Lukes; translated by W.D. Halls). New York: Free Press, 1982, pp. 50-59). See the Sociological Imagination diagram below.
The national cost of a gallon of gas, the War in the Middle East, the repressed economy, the trend of having too few females in the 18-24 year old singles market, and the ever-increasing demand for plastic surgery are just a few of the social facts at play today. Social facts are typically outside of the control of average people. They occur in the complexities of modern society and impact us, but we rarely find a way to significantly impact them back. This is because, as Mills taught, we live much of our lives on the personal level and much of society happens at the larger social level. Without knowledge of the larger social and personal levels of social experiences, we live in what Mills called a False Social Conscious which is an ignorance of social facts and the larger social picture.
Personal troubles are private problems experienced within the character of the individual and the range of their immediate relation to others. Mills identified the fact that we function in our personal lives as actors and actresses who make choices about our friends, family, groups, work, school, and other issues within our control. A college student who parties 4 nights out of 7, who rarely attends class, and who never does his homework has a personal trouble that interferes with his odds of success in college. On the other hand, when 50 percent of all college students in the country never graduate, we call that a larger social issue.
Larger Social Issues are those that lie beyond one's personal control and the range of one's inner life. These pertain to society's organizations and processes. These are rooted in society rather than in the individual. Nationwide, students come to college as freshmen ill-prepared to understand the rigors of college life. They haven’t often been challenged enough in high school to make the necessary adjustments required to succeed as college students. Nationwide, the average teenager text messages, surfs the net, plays video or online games, hangs out at the mall, watches TV and movies, spends hours each day with friends, and works at least part-time. Where and when would he or she get experience focusing attention on college studies and the rigors of self-discipline required to transition into college credits, a quarter or a semester, studying, papers, projects, field trips, group work, or test taking.
Figure 1. Diagram of the Seven Social Institutions and the Sociological Imagination.
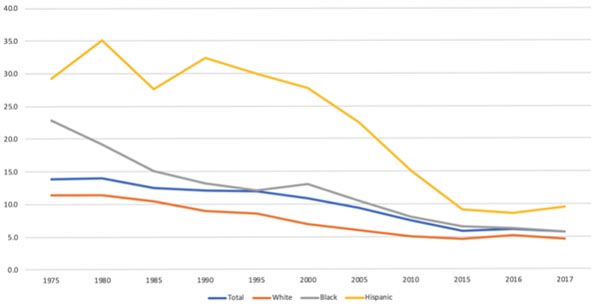
The worst possible scenario in terms of work and lifestyle is to drop out of high school. The National Center for Education Statistics regularly reports on academic performance. Figure 2 shows the Dropout rates for the US between 1975-2017. The High School Dropout rates ( not graduated or earned a GED nor enrolled in any institution by ages 16-24) has been higher for Whites aged 16-24 than for Blacks and Hispanics since 1975. But in all 3 racial categories, Dropout rates have been steadily declining over the last 45+ years. The declines are far more dramatic for Hispanics who had a much higher Dropout rate than Whites and Blacks.
Figure 2. US Ages 16-24: Status High School Dropout Rate between 1975-2017 (NCES)
The worst possible scenario in terms of work and lifestyle is to drop out of high school. And millions drop out each year in the US. Table 1 shows the dropout rates by racial classification for the US. Although all racial categories are showing improvement between 1011-2017, American Indians/Native Americans have the highest dropout rate in 2017 (10.1%); followed by Hispanics (8.2%); Blacks (6.5%0; Whites (4.3%); and Asians at only (2.1%). Dropping out of High School adds increased economic challenges through all that income lost; all that lifestyle forfeit; and all those other benefits of higher education missed.
Table 1: Dropout Rates by Racial Classification in the United States 2010-2017
| Group | 20171 | 20112 |
|---|---|---|
| AM. Indian (Native Am.) | 10.1% | 35% |
| Hispanic | 8.2% | 29% |
| Black (African Am.) | 6.5% | 33% |
| White (non-Hispanic) | 4.3% | 16% |
| Asian | 2.1% | 13% |
The majority of college first year students drop out, because nationwide we have a deficit in the preparation and readiness of Freshmen attending college and a real disconnect in their ability to connect to college in such a way that they feel they belong to it. In fact, college dropouts are an example of both a larger social issue and personal trouble. Thousands of studies and millions of dollars have been spent on how to increase a Freshman student’s odds of success in college (graduating with a 4-year degree). There are millions of dollars worth of grant money awarded each year to help retain college students. Interestingly, almost all of the grants are targeted in such a way that a specific college can create a specific program to help each individual student stay in college and graduate.
The real power of the sociological imagination is found in how you and I learn to distinguish between the personal and social levels in our own lives. Once we do, we can make personal choices that serve us best, given the larger social forces that we face. In 1991, I graduated with my Ph.D. and found myself in a very competitive job market for University professor/researcher positions. With hundreds of my own job applications out there, I kept finishing second or third and was losing out to 10 year veteran professors who applied for entry level jobs. I looked carefully at the job market, keeping in mind my deep interest in teaching, the struggling economy, and my sense of urgency in obtaining a salary and benefits. I came to the decision to switch my job search focus from university research to college teaching positions. Again, the competition was intense. On my 301st job application (that’s not an exaggeration), I interviewed and beat out 47 other candidates for my current position. In this case, knowing and seeing the larger social troubles that impacted my success or failure helped in finding a position. Because of the Sociological Imagination, I was empowered because I understood the larger social job market, and was able to best situate myself within it.
Making Sense of Divorce Using the Sociological Imagination
Let's apply the sociological imagination to something most students are deeply concerned about—divorce. Are there larger social and personal factors that will impact your own risk of divorce? Yes. In spite of the fact that in 2019, over 137 million individuals who were married in the U.S., divorce continues to be a very common occurrence (retrieved 1 July 2020 from MS-1. Marital Status of the Population 15 Years Old and Over by Sex, Race and Hispanic Origin: 1950 to Present. SOURCE.
What’s in the larger social picture? Estimates for the U.S. suggest that 85 percent of us will marry (Retrieved 19 May, 2014 SOURCE) Yet, so many of us feel tremendous anxiety about marriage. The U.S. Census Bureau conducts annual surveys of the U.S. population and publishes them as the Current Population Surveys. As of 2019 the U.S. Family Types indicated 137 million married (53%); 14+ million widowed (6%); 25+ million divorced (10%); and over 85 million never married (32%). (retrieved 1 July 2020 from MS-1. Marital Status of the Population 15 Years Old and Over by Sex, Race and Hispanic Origin: 1950 to Present SOURCE ) There has also been a marked increase of non-married cohabiting couples over the last few decades. Pew Research reported in as of 2017, 50 percent of adults had ever married and 59 percent had ever cohabited. This is changed from their 2002 findings that about 60 percent had ever married and only 54 percent had ever cohabited (Marriage and Cohabitation in the U.S., 6 Nov. 2019 retrieved 1 July 2020 from SOURCE
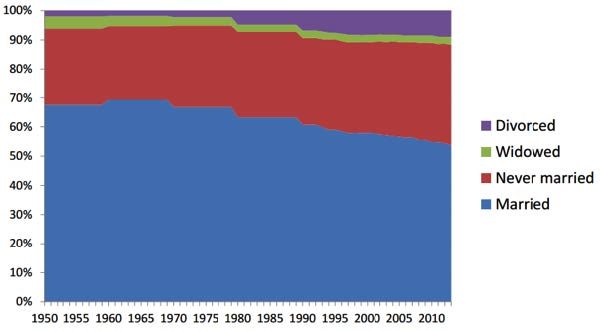
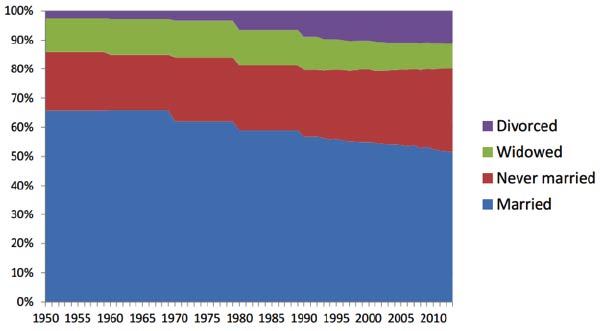
Now take a look at Figure 3 below to see the U.S. trend of actual numbers in millions of family types between the years 1950-2013. It shows that the most common type of family in the U.S. has always been marrieds, and the second most common has always been never marrieds. The number of divorced families overtook the widowed category in the 1970s and has been higher ever since. Why are the trends upward? Simply put, these are numbers and not rates nor percentages. The population has grown and therefore the population size has been steadily increasing.
Figure 3. United States 1950-2013 Men’s and Women’s Marital Status (15 and over)
You may already be seeing the wisdom of analysis found in sociology and especially in C. Wright Mills’ sociological imagination. It provides personal and larger social insight into what we can do to have a good marriage and avoid divorce. However; before we discuss these, lets set the record straight. There never was a 1 in 2 chance of getting divorced in the U.S. (see http://www.Rutgers.edu the National Marriage Project, 2004 "The State of Our Unions" or Kalman Heller "The Myth of the High Rate of Divorce taken from Internet 16 May, 2014 SOURCE).

Divorce rates peaked in the 1980’s and have steadily declined since then (See Figure 4 below). Even though all married people are at risk of divorce, most of them will not face this reality. Many studies have consistently shown exactly how our personal choices and behaviors can actually minimize our chances of divorce. Here’s a brief summary: -Wait to marry until you reach your mid-20’s. Teens who marry have the highest risk of divorce (see Center for Disease Control "First Marriage Dissolution, Divorce, and Remarriage: United States taken from Internet 16 May, 2014 SOURCE ).
-Avoid cohabitation if you plan to ever marry. While cohabitation is on the rise in the U.S., it is still associated with higher risks of divorce once one is married. Numerous studies have rigorously researched the impact of having cohabited on the odds of marital success. (see Lisa Mincieli and Kristin Moore, "The Relationship Context of Births Outside of Marriage: The Rise of Cohabitation," Child Trends Research Brief 2007-13 (May 2007); or Matthew D. Bramlett and William D. Mosher, Cohabitation, Marriage, Divorce and Remarriage in the United States, National Center for Health Statistics, Vital and Health Statistics, 23 (22), 2002; Or Larry Bumpass and Hsien-Hen Lu, "Trends in Cohabitation and Implications for Children’s Family Contexts in the U. S.," Population Studies 54 (2000): 29-41; or Jay Teachman, "Premarital Sex, Premarital Cohabitation, and the Risk of Subsequent Marital Disruption among Women," Journal of Marriage and the Family 65 (2003): 444-455.
-Finish college. Dropouts are much more likely than their peers who graduate to be unemployed, living in poverty, receiving public assistance, in prison, on death row, unhealthy, divorced, and be single parents (SOURCE).
-Be aware of the three-strike issue: Strike 1, you are poor; Strike 2, you are a teenager when you marry; and Strike 3, you are pregnant when you marry. These issues could prove to be a terminal combination of risk factors as far as staying married is concerned. These three in combination with others listed below may increase your risk of divorce.
-Know which factors you can control that will likely impact your marital success odds. Other scientifically identified divorce risk factors include: high personal debt; falling out of love; not proactively maintaining your marital relationship; marrying someone who has little in common with you; infidelity; remaining mentally "on the marriage market…waiting for someone better to come along," having parents who divorced; neither preparing for nor managing the stresses that come with raising children, and divorcing because the marriage appears unhappy and hopeless in terms of resolving negative issues (see Glenn, N. 1991 "Recent trends in Marital Success in the US" May, J. of Marriage and the Family, pages 261-270). Often couples on the fringe of divorce later emerge from those states of unhappiness and hopelessness with renewed happiness and hope, by simply enduring the difficult years together.
In all of these factors listed above you can decide how to best situate yourself to deal with the certain issues before divorce becomes the ultimate outcome. But, as Mills taught, you must consider both personal and larger social issues simultaneously to fully benefit from the sociological imagination. It is true that divorce is still very common in the U.S. Notice the peak on this figure found in the 1980s, and the trend (at least up to the most recent 2010 data) shows a slightly decreased pattern since then. Figure 4 shows the divorce rate in the US from 1920-2010. This particular rate is the number of divorces per year per 1,000 people (males and females combined). Over the last 30 years, the overall divorce rate has declined steadily.
Figure 4. US Number of Divorces Per 1,000 Population Members 1920-2010
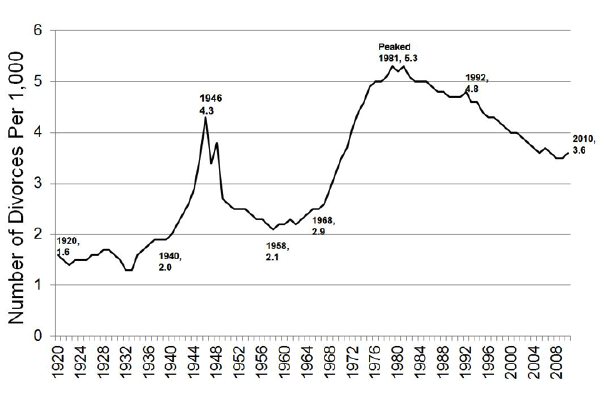
What are some of the larger social factors that have historically contributed to these patterns of divorce? You’ll notice a brief spike in divorce after World War II. The post-war year, 1946, was a true anomaly as far as rates measuring the family are concerned. It was the highest rate of marriages, highest rate of births (The Baby Boom began in 1946), and the lowest median age at marriage in U.S. history. Divorce rates surged in 1946 as all the soldiers returned home having been changed by the trauma, isolation from their families, and challenges of the war. They were probably less compatible with their wives once they came back. Divorces tended to follow wars for marriages where one spouse is deployed into combat (WWI, WWII, Vietnam, Korea, Kuwait, and Iraq).
Other factors influencing this divorce pattern have to do with the economy, marriage market, and other factors. Divorces continue to be high during economic prosperity and often decline during economic hardships. Divorces tend to be higher if there is an abundance of single women in the society. And divorces tend to be more common in: urban rather than rural areas; the Western US than in the Eastern; among the poor, less educated, remarried, less religiously devout, and children of divorce. Please note that recession, war, secularism, and western US cultures don’t cause divorce. Scientists have never identified a "cause" for divorce. But, they have clearly identified risk factors.
Could there be larger social factors pressuring your marriage right now? Yes, but you are probably not enslaved to those forces. They still impact you, and you can follow Mill’s ideas and manage as best you can within your power concerning consequences of these forces. What can you do about it? Well, if you are single, you’d best situate yourself in terms of marital success by waiting to marry until you are in your 20’s, finishing and graduating from college, paying careful attention to finding the right person (especially one with common values similar to your own), and doing some sort of self-analysis to assess working proactively to nurture your marriage relationship on an ongoing basis. Finding counseling to help mediate the influence of your parents' divorce on your current marital relationship can also be helpful. If you are married and things appear to hit a wall, consider counseling, consulting with other couples, and reading self-help books. Often the insurmountable walls that couples face in marriage slowly collapse with time and concerted effort.
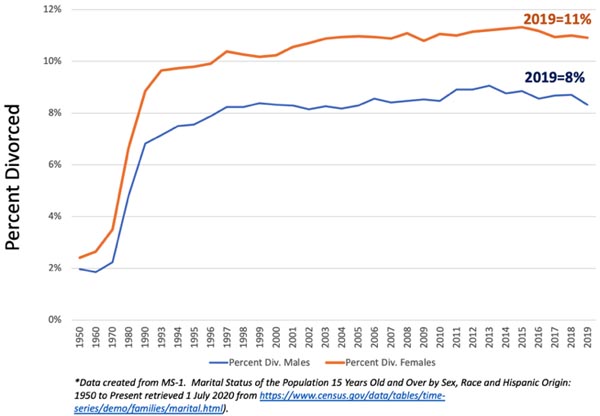
Figure 5 shows the percent of adults ages 15+ who are divorced each year between 1950 and 2019, for both males and females. Notice that back in 1950, the percent of divorced males was about 1.96 percent and divorced females about 2.40%. There was really only a 1950 difference of 0.44 percent higher percent among females. Then in 2019 the percent of divorced males was about 8.33 percent and divorced females about 10.92%. In the U.S. since divorce data were collected, there were always more females among divorced adults than males. Why? The answer is complicated, but Sociological research allows me to give you a simplified answer.
At the larger social level divorce courts tend to award custody to women and even though recently shared joint custody is most common; the children need a “residence” from which they attend school. Women almost always have residential custody after a divorce. That means the children consider their Mother’s home to be their “permanent home” and their Father’s home a place they stay when they “visit their Father.” That said, if a divorced woman decides to find another husband to marry, her personal-level “pros and cons” that she brings to the marriage marketplace include the fact that a potential new husband would be married to her and be a co-parent to her children from another relationship. Another larger social level issue is that U.S. culture still affords men the cultural advantage of being the one who proposes and the one who is arguably in the better negotiating status (this deserve a much more in depth treatment than received here (see Remarriage discussion in Free Sociology of the Family Chapters 12 and 13).
Figure 5. Percent of Male and Female Adults Ages 15+ who are Divorced Select Years 1950 and 2019.
Years ago, a colleague and I wrote a self-assessment to help students identify the personal divorce risks so that they could strategize what to do when faced with those risks. Take 10 minutes and learn what you can about your own divorce risks. (also take the time to watch another example of the Sociological Imagination in the case of W. E. B. Du Bois below). VIEW Divorce Risks Assessment Questionnaire PDF
One last note about the Sociological Imagination. One of my personal heroes is W.E.B. Du Bois. He was the first black Harvard Graduate, the first to scientifically analyze U.S. blacks (see The Philadelphia Negro), and one of the most prolific Sociological writers ever. Watch my short lecture video on how the Sociological Imagination helps us to understand the personal lives of this hero, and think about the tragedy that could have been had he grown up in the U.S. Southern states instead of in Massachusetts. A cool video on W. E. B. Du Bois.
Additional Reading
- NARME National Association for Relationship and Marriage Education
- CYFERNet provides practical, research-based information for children, youth, parents and families. Fantastic resource. One of the most extensive sites on the Internet. For marriage information, click on "Parent and Family" then search down to marriage listed under the subtitle of partners.
- USDA My Plate
- Divorce Busting
- Michele Weiner Davis, M.S.W. is a therapist specializing in a revolutionary approach that helps couples make their relationships better than ever. This is an excellent resource for obtaining books/tapes about saving your marriage.
- National Institute of Relationship Enhancement (NIRE) is the developer of the successful Relationship Enhancement (RE). RE works in a variety of settings and helps various circumstances including pre-marital and martial enrichment.
- The Pairs Foundation This website reveals practical application of intimate relationship skills.